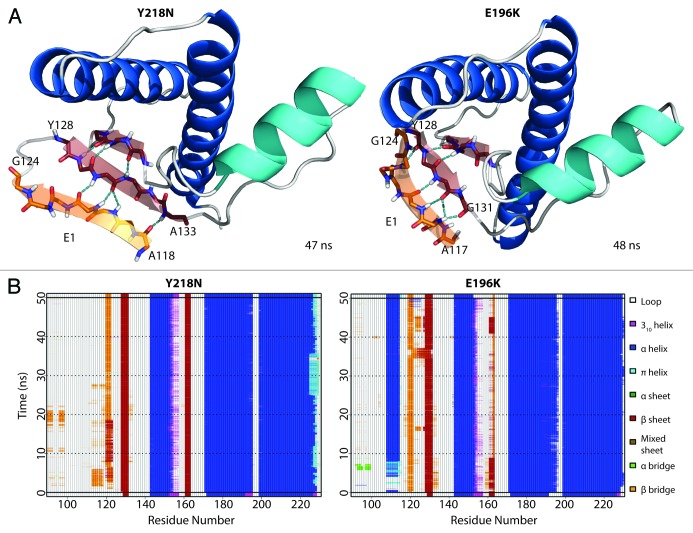
Figure 9. Formation of nonnative strand (E1) in both Y218N and E196K simulations. (A) Representative E1 structure for each mutant. Backbone of E1 is shown in sticks with carbon atoms colored in orange. Carbon atoms of the extended native sheets are colored in red. Hydrogen bonds between strands are indicated with the cyan dashed lines. The N- and C-terminal residues for E1 and the extended S1 strand (in red) are labeled. (B) Secondary structure analysis of simulation 2 of Y218N and simulation 3 of E196K.

An official website of the United States government
Here's how you know
Official websites use .gov
A
.gov website belongs to an official
government organization in the United States.
Secure .gov websites use HTTPS
A lock (
) or https:// means you've safely
connected to the .gov website. Share sensitive
information only on official, secure websites.
