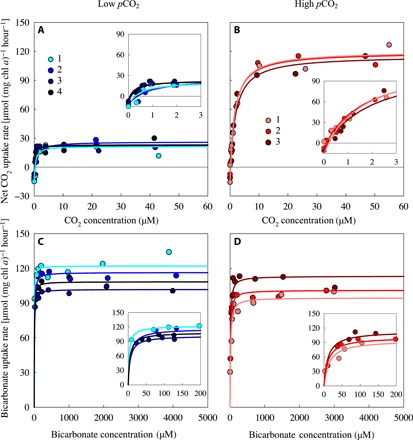
Fig. 2. Carbon uptake kinetics of Microcystis PCC 7806 acclimated to either low or high pCO2.

(A and B) Net CO2 uptake rate as function of the dissolved CO2 concentration, after acclimation to (A) low pCO2 and (B) high pCO2. (C and D) Bicarbonate uptake rate as function of the bicarbonate concentration, after acclimation to (C) low pCO2 and (D) high pCO2. Carbon uptake kinetics were measured after ~20 days of acclimation to the steady-state conditions in the chemostats. Measurements were replicated fourfold at low pCO2 and threefold at high pCO2, as indicated by the different colors. Lines are Michaelis-Menten fits to each of the replicates (see table S2 for parameter estimates). Insets zoom in at the carbon uptake kinetics at low dissolved CO2 and bicarbonate concentrations.
