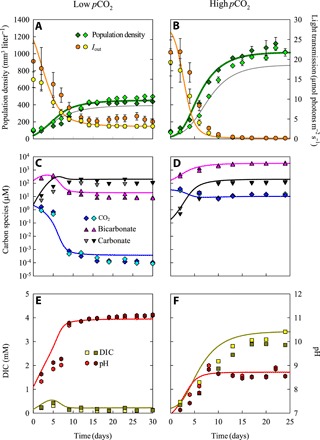
Fig. 4. Population density, inorganic carbon chemistry, and pH in chemostat experiments with Microcystis PCC 7806 at low and at high pCO2.

Chemostat experiments were performed in duplicate, at low pCO2 (left) and at high pCO2 (right). (A and B) Microcystis population density (n = 3 technical replicates per chemostat) and light intensity Iout transmitted through the chemostat (n = 10). (C and D) Dissolved CO2, bicarbonate, and carbonate concentrations. (E and F) Dissolved inorganic carbon (DIC) and pH (n = 3 technical replicates per chemostat). Symbols indicate experimental data of the duplicate chemostat experiments, error bars indicate SDs of technical replicates, and lines indicate model predictions. Error bars in (E) and (F) did not exceed the size of the symbols. For comparison, gray lines in (A) and (B) are model predictions for nonacclimated cells that either (A) grow at low pCO2 but with carbon uptake kinetics acclimated to high pCO2 or (B) grow at high pCO2 but with carbon uptake kinetics acclimated low pCO2. Steady-state characteristics of the experiments are summarized in table S1, and parameter values of the model are listed in tables S4 and S5.
