
Fig. 5. In vivo cytotoxicity of light-activated primary human T cells.
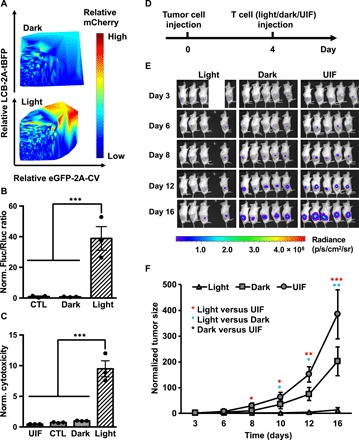
(A) Gene induction efficiency of LINTAD strongly depends on concentrations of regulators. Primary human T cells were infected with LCB-2A-tBFP and eGFP-2A-CV to indicate the expression levels of LINTAD regulators. Light-inducible mCherry reporter was used to determine the gene induction level. The intensity (and hence induction level) of mCherry is color coded, with cold and hot colors representing low and high levels. Dark, without light stimulation; Light, with 12 hours of blue light stimulation. (B) Light-inducible gene expression using WW-LINTAD in primary T cells. Light and Dark: T cells infected with lentiviral WW-LINTAD (LWWCB and WP1CV) and Fluc reporter (with constitutive Rluc as internal reference) were stimulated with (light) or without (dark) for 12 hours. CTL, control T cells infected with only the LWWCB component and reporter. Fluc/Rluc ratios represent gene induction levels and are normalized to that of the dark group. (C) Cytotoxicity of T cells engineered with WW-LINTAD, light-inducible Cre reporter, and loxP-ZsGreen-stop-loxP-CD19CAR (see fig. S9). UIL, uninfected T cells. CTL, control T cells infected with only the LWWCB component of WW-LINTAD, Cre reporter, and loxP-ZsGreen-stop-loxP-CD19CAR. Dark, without light stimulation; Light, with 12 hours of light stimulation. Different groups of T cells were cocultured with Fluc+ Nalm-6 cells for 24 hours. Fluc activities of the remaining live Nalm-6 cells after coculture were quantified. Cytotoxicity values were calculated as 1/Fluc and normalized to that of the dark group. Data represent mean values ± SEM (n = 3 independent experiments). (D to F) In vivo cytotoxicity of light-inducible T cells after in vitro light stimulation. NSG mice were subcutaneously injected with Fluc+ Nalm-6 cells on the right flank. Primary human T cells engineered with WW-LINTAD, light-inducible Cre reporter, and loxP-ZsGreen-stop-loxP-CD19CAR were treated with (light) or without (dark) 12 hours of blue light, followed by local injection into the mice at the tumor sites. Uninfected T cells (“UIF”) were used as control following the same procedures. (D) Timeline of tumor inoculation and T cell injection. (E) Tumor burden was quantified by bioluminescence imaging (BLI) after tumor inoculation for 16 days. We only included four mice in the light group, because the engineered T cells were not sufficient for five mice as planned due to accidental cell loss during experimental processes. (F) Quantification of tumor aggressiveness in different groups in (E). The integrated luminescence of a tumor at each time point was normalized to that of the same tumor on day 3 (before T cell injection). Data represent mean ± SEM (n = 4 mice for “Light,” n = 5 mice for “Dark” and “UIF”). *P < 0.05; **P < 0.01; ***P < 0.001. One-way ANOVA, followed by Fisher’s least significant difference multiple comparison test was used for (B), (C), and (F).