
Fig. 1. Gene prioritization in loci associated with IgG N-glycosylation.
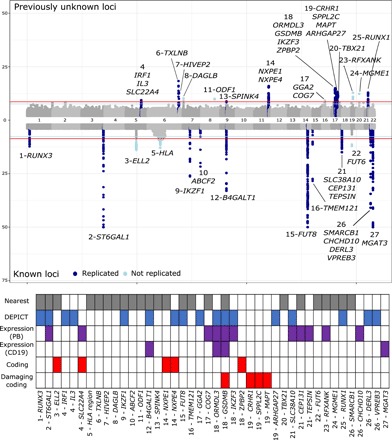
The Manhattan plot was created by taking the lowest P value at every genomic position from all 77 GWAS. For simplicity, the plot was trimmed at the equivalent of P = 10−50. The lowest observed P value in this analysis was 4.65 × 10−276 at ST6GAL1. Known loci, loci detected in previous IgG N-glycosylation GWAS; replicated, UPLC replication GWAS. Bottom: Summary of support for prioritization of every gene in the Manhattan plot. DEPICT, genes from enriched gene sets; expression, genes whose expression is pleiotropic with IgG N-glycosylation; CD19, B cells; PB, peripheral blood; coding, genes for which IgG N-glycosylation–associated SNP results in a changed amino acid sequence.