
Fig. 2. Functional network of loci associated with IgG N-glycosylation.
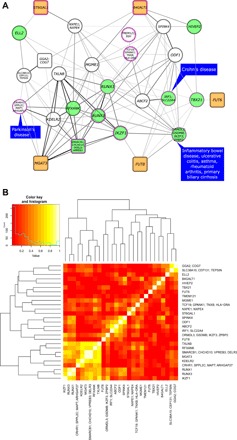
Correlation estimates are computed on the basis of squared pairwise Spearman’s correlation of SNP effects. The loci are denoted with names of genes that were prioritized in regions tagged by the given lead SNP. (A) Functional network of loci associated with IgG N-glycosylation. In this network, each node represents a lead SNP in the locus, and each edge represents the squared correlation of glycome-wide effects of the two nodes. Only significant correlations after multiple testing correction (P ≤ 1.4 × 10⁻⁴) are shown. The thickness and intensity of edges depend on variation in one locus explained by the effect estimates in the second locus. Round-edged rectangular nodes denote genes that are, according to GO, involved in glycosylation; purple-edged nodes denote genes involved in immune system processes; green nodes denote loci containing genes involved in transcription regulation; orange nodes denote glycosyltransferases; and blue rectangles indicate diseases pleiotropic with IgG glycans in the given locus (Table 3). (B) Hierarchical clustering of pairwise Spearman’s locus-effect correlations.