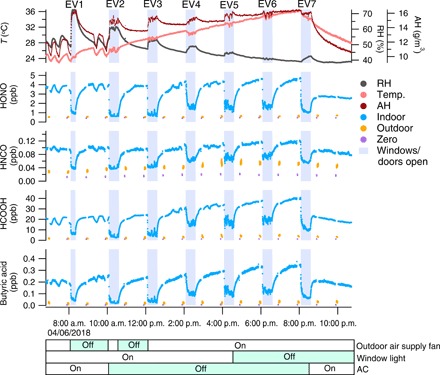
Fig. 1. Indoor mixing ratios of several acids during EV experiments.

The top panel shows the measured house temperature (T; left axis), relative humidity (RH; right axis), and absolute humidity (AH; second right axis). Temperature and RH were measured in the kitchen within 1 m of the CIMS inlet. The shaded areas indicate when doors and windows were open to increase the ventilation rate of the house. The hourly 2-min background measurement (measuring zero air) is shown with purple dots, followed by a 5-min outdoor measurement (orange dots). The average air exchange rate (AER) when the house is closed following each EV experiment is summarized in table S2. The color bars at the bottom of the plot show the state of outdoor air supply fan (on/off), window light (with/without), and air conditioning (AC) (on/off) during the experiment, with the green shaded periods showing when the fan, window light, and AC were off.
