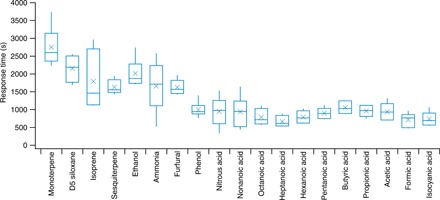
Fig. 2. Box and whisker plot of response time constants.

Only the first six EV experiments (EV1 to EV6) are shown. Response times for EV7 are not shown due to the significant change of house conditions, i.e., dehumidification associated with air conditioner operation. The horizontal line and the cross symbol inside each box denote the median and the mean, respectively. The top and bottom boundaries of each box show the third and first quartiles. The top and bottom of the vertical line (i.e., the whisker) show the maximum and minimum data points, respectively. The acids were measured with CIMS (acetic acid measured with iodide CIMS and the others measured with acetate CIMS), and the nonacidic compounds were measured with the PTR-TOF-MS, except for NH3, which was measured by cavity ring-down spectroscopy. Data for D5 siloxane in EV1 and EV2 and for acetic acid in EV5 were excluded due to interferences.
