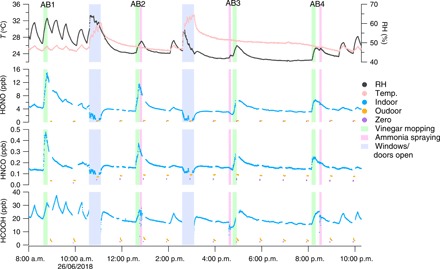
Fig. 3. Indoor air acid mixing ratios during vinegar and ammonia cleaning.

AB1 to AB4 represent four acid-base experiments. The shaded areas show when doors and windows were open to enhance house ventilation (blue). Times of mopping the floor with vinegar solution (green) and spraying ammonia on indoor surfaces (pink) are also indicated. Mixing ratios measured in outdoor air and for zero air are denoted by orange and purple dots. The top panel shows the RH and temperature measured in the kitchen. The AC system was turned off during the two ventilation periods.
