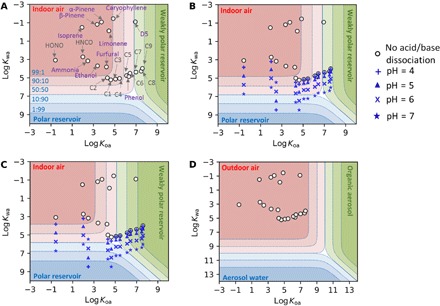
Fig. 4. Partitioning space plots.

(A) An indoor environment with 1.5 × 10⁻⁷ m3 of weakly polar and polar reservoirs each per cubic meter of air, without acid and base dissociation; (B) same volume of polar and weakly polar reservoirs as in (A), but considering acid and base dissociation in the polar reservoir; (C) 7.5 × 10⁻⁶ m3 and 1.5 × 10⁻⁶ m3 of weakly polar and polar reservoir per cubic meter of air, respectively, with acid and base dissociation; and (D) a highly polluted outdoor environment with 100 mg m–3 each for liquid water and organic content in the ambient aerosol [phase separated into organic (represented by octanol) and water phase (51)], with acid and base dissociation. Names of the individual species are labeled in (A), with C1 to C9 representing monocarboxylic acids with one to nine carbons; their locations shift slightly in (B) and (C) relative to the boundaries, but the ordering does not change. The dashed lines in the space indicate boundaries for different fractions of compounds in each phase, and the blue text shows the fraction in gas versus polar phase for the dashed line below the blue label. The different symbols in (B) to (D) indicate the assumed pH of the polar phase, as indicated in the legend. Note that, in (D), the range of log Kwa and log Koa is expanded to 13, as compared to 10 in (A) to (C).
