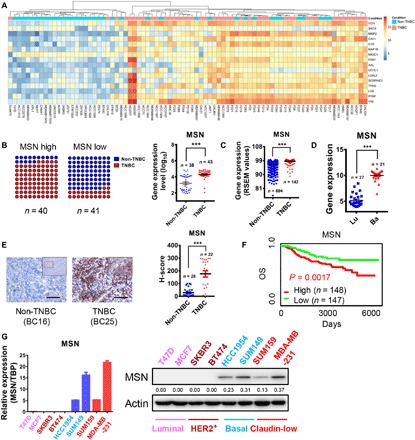
Fig. 1. MSN was highly expressed in TNBC and positively correlated with the breast cancer malignancy.

(A) We performed RNA-seq on 43 TNBC and 38 non-TNBC cell lines or clinical samples. The relative expression values of genes used in the heatmap are processed as follows: Relative expression value of gene = log2 (actual measured value +1). (B) The results of RNA-seq were statistically analyzed. The samples were divided into two groups by median of MSN expression, MSN high and MSN low. Then, the proportion of TNBC and non-TNBC in the two groups was shown as a dot plot (left). The results of RNA-seq were used to analyze the difference of MSN expression between TNBC and non-TNBC (right). (C) The expression of MSN was analyzed in different subtypes of breast cancer samples from the dataset (TCGA Breast Cancer Illumina HiSeq percentile), which was contained in the online University of California Santa Cruz (UCSC) Xena database. RSEM, RNA-seq by expectation-maximization. (D) The expression of MSN was analyzed in breast cancer cell lines of different subtypes from the dataset (Heiser 2012) contained in the online UCSC Xena database. Lu, luminal subtype; Ba, basal subtype. (E) Immunohistochemical staining was used to detect the expression of MSN in tumor sections from 22 cases of patients with TNBC and 28 cases of non-TNBC. Scale bars, 80 μm. The histo-score (H-score) statistics are shown on the right. (F) The overall survival (OS) of patients grouped by high and low MSN expression in breast cancer from the NKI dataset contained in an online database (PROGgeneV2). (G) MSN expression level measured by qRT-PCR (left) or Western blot (right) in eight breast cancer cell lines that contain four subtypes. TBP, TATA-box binding protein. ***P < 0.001 by unpaired t test of triplicates. Error bars, means ± SEM.
