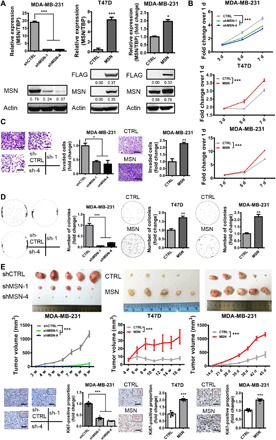
Fig. 2. MSN positively regulated the progression of breast cancer.

(A) qRT-PCR (top) and Western blot (bottom) was used to verify the knockdown or overexpression effect of MSN. (B) MTT assay was performed to determine the difference of cell proliferation ability after MSN knockdown or overexpression (n = 6). (C) Invasion assay was carried out with MSN knockdown (left) or MSN-overexpressing (right) MDA-MB-231 cells. Quantitative analysis of the total invasive cells of triplicates is shown as a bar graph. Scale bars, 200 μm (left) and 400 μm (right). CTRL, control. (D) Soft agar colony formation assay was performed using MSN knockdown MDA-MB-231 cells and MSN-overexpressing T47D or MDA-MB-231 cells. Colonies were counted in the whole field showed on the right (n = 3). (E) MDA-MB-231 shCTRL or shMSN cells were implanted into the fourth mammary fat pads at two flanks of nude mice, 1 million cells per site (n = 5). The tumor volume was measured once a week. T47D CTRL or MSN-overexpressing cells were implanted into the fourth mammary fat pads at two flanks of nude mice, 2 million cells per site (n = 5). The tumor volume was measured once every 2 weeks. MDA-MB-231 CTRL or MSN-overexpressing cells of 0.5 million were implanted into the fourth mammary fat pads at two flanks of nude mice (n = 5). The tumor volume was measured at indicated time. At the end of experiments, the tumors were taken out and the images are shown. Ki67 staining was performed by IHC (immunohistochemistry), and Ki67-positive proportions are shown on the right. Scale bars, 80 μm. Photo credit: Yuanyuan Qin, University of Science and Technology of China. **P < 0.01 and ***P < 0.001 by unpaired t test of triplicates or test of two-way ANOVA versus shCTRL or CTRL group. Error bars, means ± SEM.
