
Fig 8. KEGG Phagosome pathway.
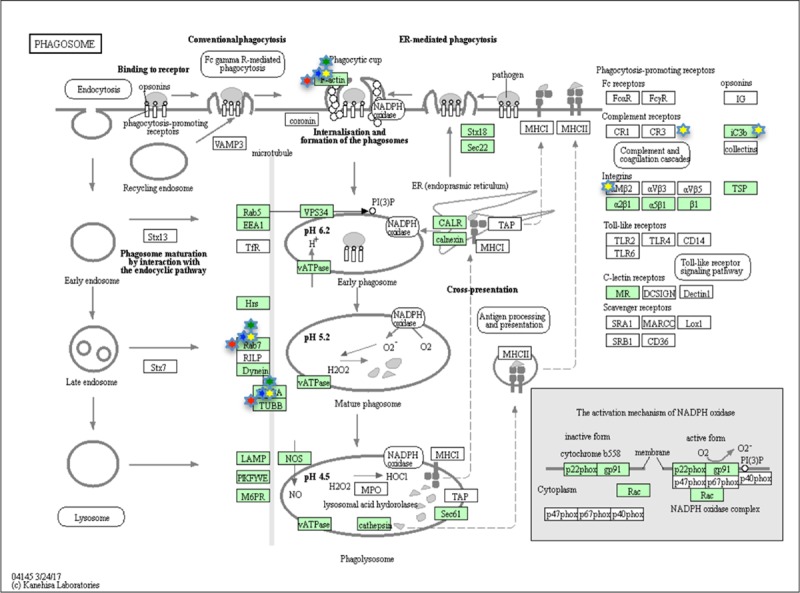
Phagosome pathway as showed by the KEGG database. Proteins in the pathway are depicted by boxes while arrows depict signaling routes. Red stars correspond to modulated proteins, identified by the MS analysis, at 1HPLT ((Hours post LPS treatment), blue stars at 3 HPLT, green stars at 6HPLT and yellow stars at 24HPLT.