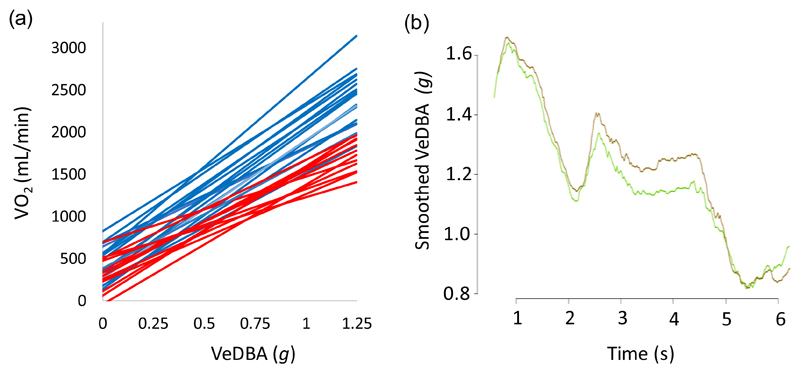
Figure 2.
The variation in VeDBA according to the logger position. (a) The best fit relationships between (mean) VeDBA and oxygen consumption for 15 humans moving on a treadmill at various speeds. DBA metrics were either calculated from an accelerometer mounted on the upper-back (blue lines) or waist (red lines). Each line shows fits from one individual derived from >10 speeds (see supplementary information 2). (b) The difference in smoothed VeDBA (over 0.5 s) for a pigeon taking flight equipped with two tri-axial accelerometers, one on the upper back (green line) and one on the lower back (brown line). The difference between the signals varies with the flight phase (see supplementary information 3).

