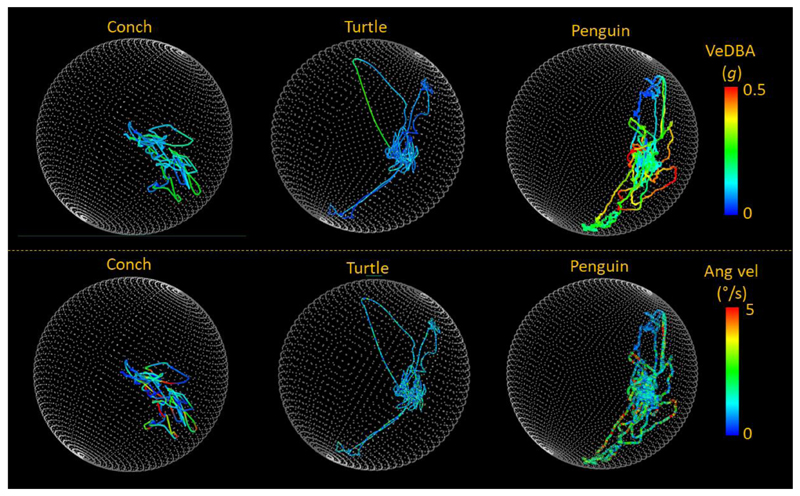
Figure 8.
Five minutes of general activity of three different species (the Giant spider conch Lambis truncata, Loggerhead turtle Caretta caretta and Magellanic penguin Spheniscus magellanicus) manifest on ‘g-spheres’ (which show the extent to which the body pitches and rolls [if the whole sphere were covered, the animal would have adopted all pitch and roll combinations] (Wilson et al. 2016)). Lines are colour-coded by metrics which may be useful as a proxy for rate of energy expenditure. Note how the DBA signal (VeDBA smoothed over 2 s) is most extensive in the penguin, as the animal that shows the most dynamism, but how body angular velocity is appreciable in all three species.

