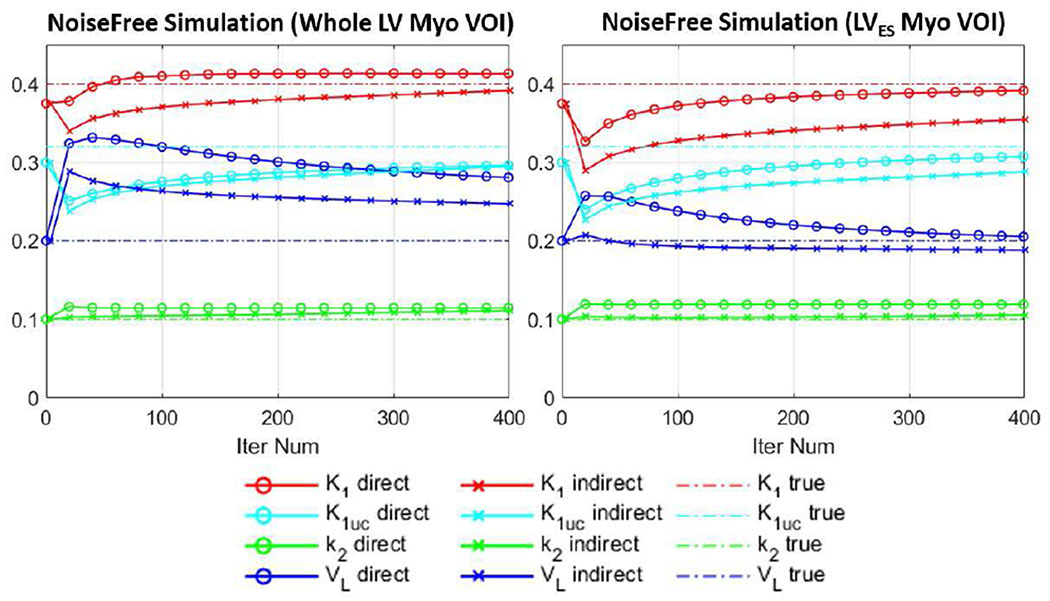
Fig. 4.
Plots of measured K1, K1,uncorr (K1uc), k2 and VL parameters vs. iteration in two VOIs (whole LV myocardium and LVES myocardium) for the simulation study. The results were shown every 20 iterations for 400 iterations. Direct (circled lines) and indirect (crossed lines) methods were compared. Ground truth values were given by dashed lines.

