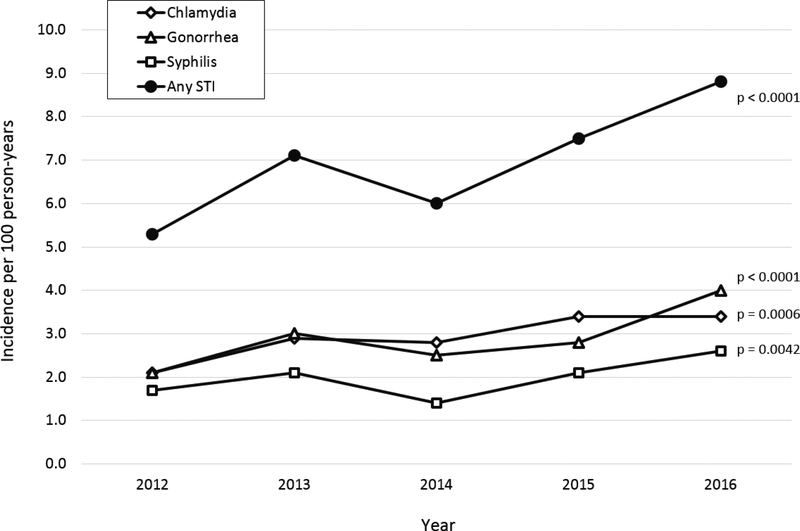
Figure 1: Incidence rates of sexually transmitted infections by year among DC Cohort participants, 2012–2016.
Incidence rates are presented per 100 person-years of follow-up.
P-values are based on a linear test of trend across the five years.
An STI episode may include any combination of chlamydia, gonorrhea, and syphilis diagnosed at the same date.

