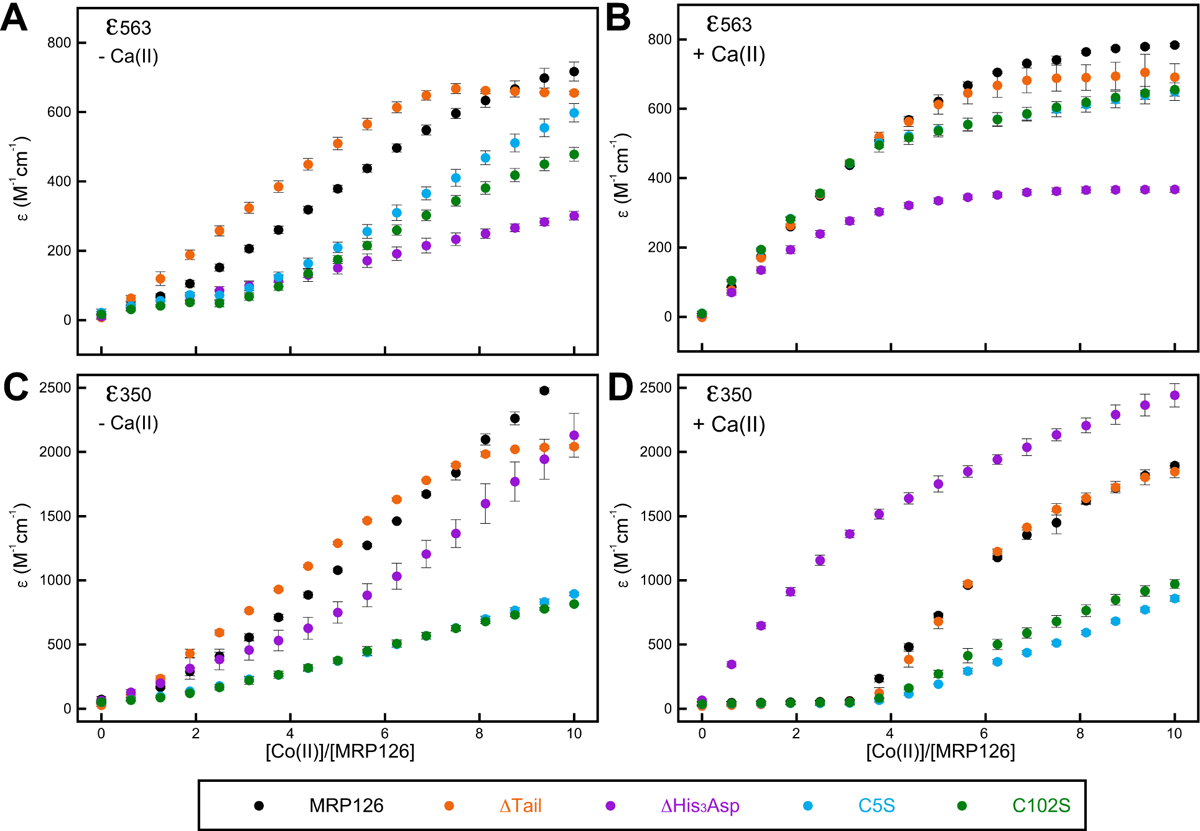
Figure 7. Optical absorption data indicate His3Asp site fills first in presence of Ca(II).

Optical absorption values for the Co(II) d–d transition at 563 nm corresponding to binding at the His3Asp site (A-B) and a Co(II)–S charge transfer transition at 350 nm corresponding to binding to the Cys2His2 site (C-D), taken from the titrations seen in Figures 6 and S16 (mean ± SEM, n ≥ 2).
