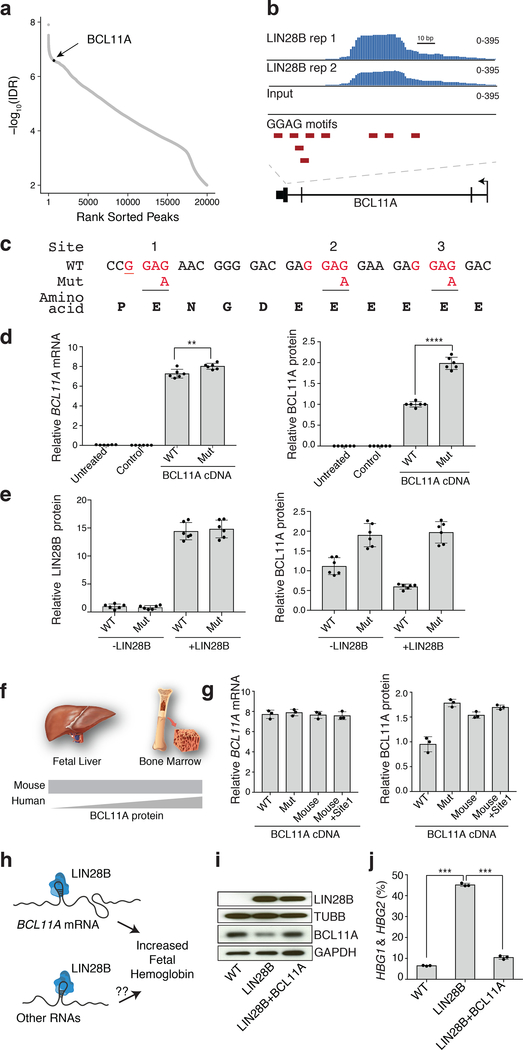
Fig. 4. BCL11A mRNA is directly bound by LIN28B and is the major target for fetal hemoglobin induction.
a, Rank-ordered predicted binding sites of LIN28B by irreproducible discovery rate (IDR), highlighting BCL11A mRNA. b, Genomic track view of predicted binding site of LIN28B in the 3’ coding region of the BCL11A mRNA. c, Three LIN28B-binding sites on BCL11A mRNA shown. Nucleotide sequence changes between wild-type (WT) and the clone with all three LIN28B-binding sites mutated (mut) highlighted in red. The synonymous change in mouse compared to human sequence (referred to as “mouse”) is underlined. The ‘mouse+Site1’ mutant has synonymous mutations in both the “mouse” site and a separate synonymous mutation in the first LIN28B-binding site. d, Relative BCL11A mRNA (left) and protein (right) upon exogenous expression of BCL11A cDNA (WT or mut) and LIN28B in 293T cells. Plotted values calculated relative to GAPDH. Untransfected 293T cells labeled as “untreated”. “Control” denotes empty vector (n = 6; 6 independent experiments). Mean plotted, error bars show s.d. Two-sided student t-test used. **P < 0.01; ****P < 0.0001. e, Relative LIN28B (left) and BCL11A (right) protein expression in 293T expressing BCL11A (WT or mut), with or without exogenous LIN28B expression. Plotted values calculated relative to GAPDH (n = 6; 6 independent experiments). Mean plotted, error bars show s.d. f, Schematic of BCL11A protein abundance in mouse and human definitive erythroid cells. g, Relative BCL11A mRNA (left) and protein (right) abundance in 293T upon exogenous expression of BCL11A cDNA (WT, mut, mouse, and mouse+Site1). (n = 6; 6 independent experiments). Mean plotted, error bars show s.d. h, Model showing the potential activities of LIN28B upon BCL11A mRNA and potentially other RNAs for the fetal hemoglobin induction. i, Representative westerns showing LIN28B and BCL11A expression after LIN28B (middle) or concomitant LIN28B and BCL11A expression (right) in adult HSPCs at day 12 (3 independent experiments). β-tubulin and GAPDH are loading controls. ‘WT’ (left) denotes uninfected primary adult erythroid cells. j, γ-globin levels in adult erythroid cells described in i, on differentiation day 12 (n = 3; 3 biologically independent experiments). Error bars show s.d. Two-sided student t-test used ***P < 0.001. Blots have been cropped and the corresponding full blots are available in the Source Data files.

