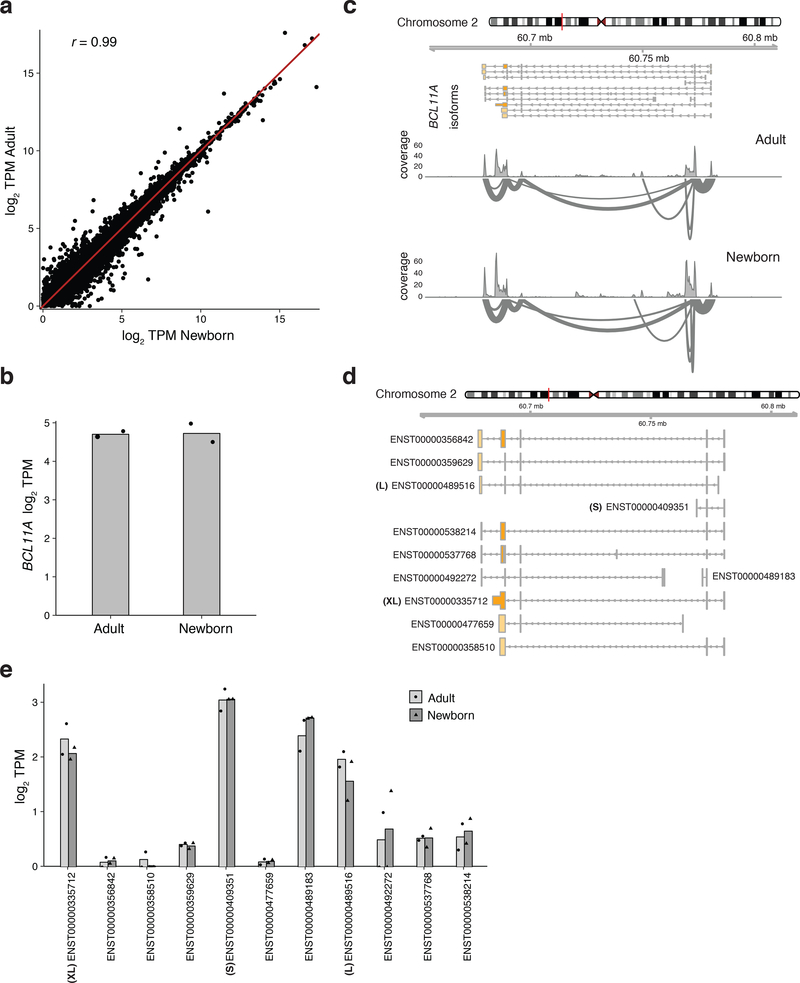
Extended Data Fig. 2:
Assessment of BCL11A and other mRNAs expressed in newborn and adult erythroid cells using RNA sequencing
a, Scatter plots of gene expression, determined from RNA-sequencing reads, expressed as log2 TPM (transcripts per million reads) in adult and newborn primary erythroid cells. ‘r’ represents the Pearson correlation coefficient. b, Expression of BCL11A, represented as log2 TPM, between newborn (n = 2) and adult (n = 2) erythroid cells. Error bars show s.d. c, BCL11A mRNA structure and splicing is comparable between developmental stages. Sashimi plots depicting exon-exon spanning reads are shown for annotated isoforms of BCL11A. d, Representation of known BCL11A isoforms. e, Relative abundances of BCL11A isoforms in newborn (n = 2) and adult (n = 2). Error bars show s.d. No transcript was differentially expressed at P < 0.01 between the newborn and adult cells.

