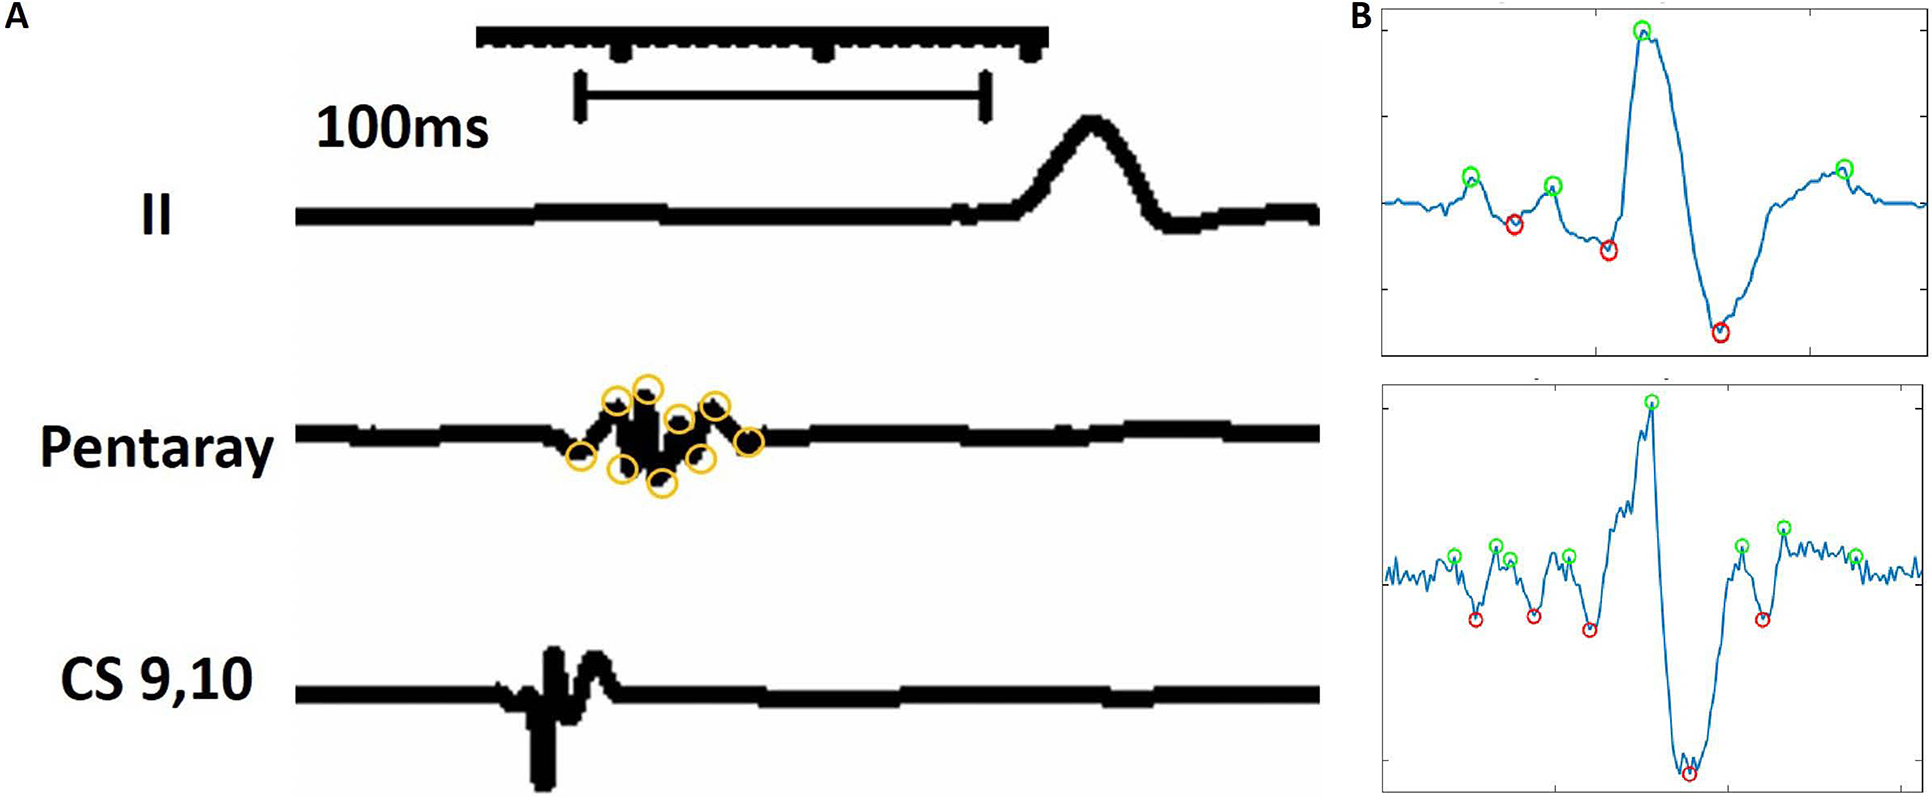
Figure 2.

Definition of fractionated atrial electrograms. The figure illustrates the measurement process for the number of deflections within each electrogram. Electrograms were displayed at a sweep speed of 200 ms. Then the number of deflections was measured as the number of peaks plus troughs. In this example, 9 deflections are noted on the atrial electrogram recording, consistent with abnormal electrogram fractionation.
