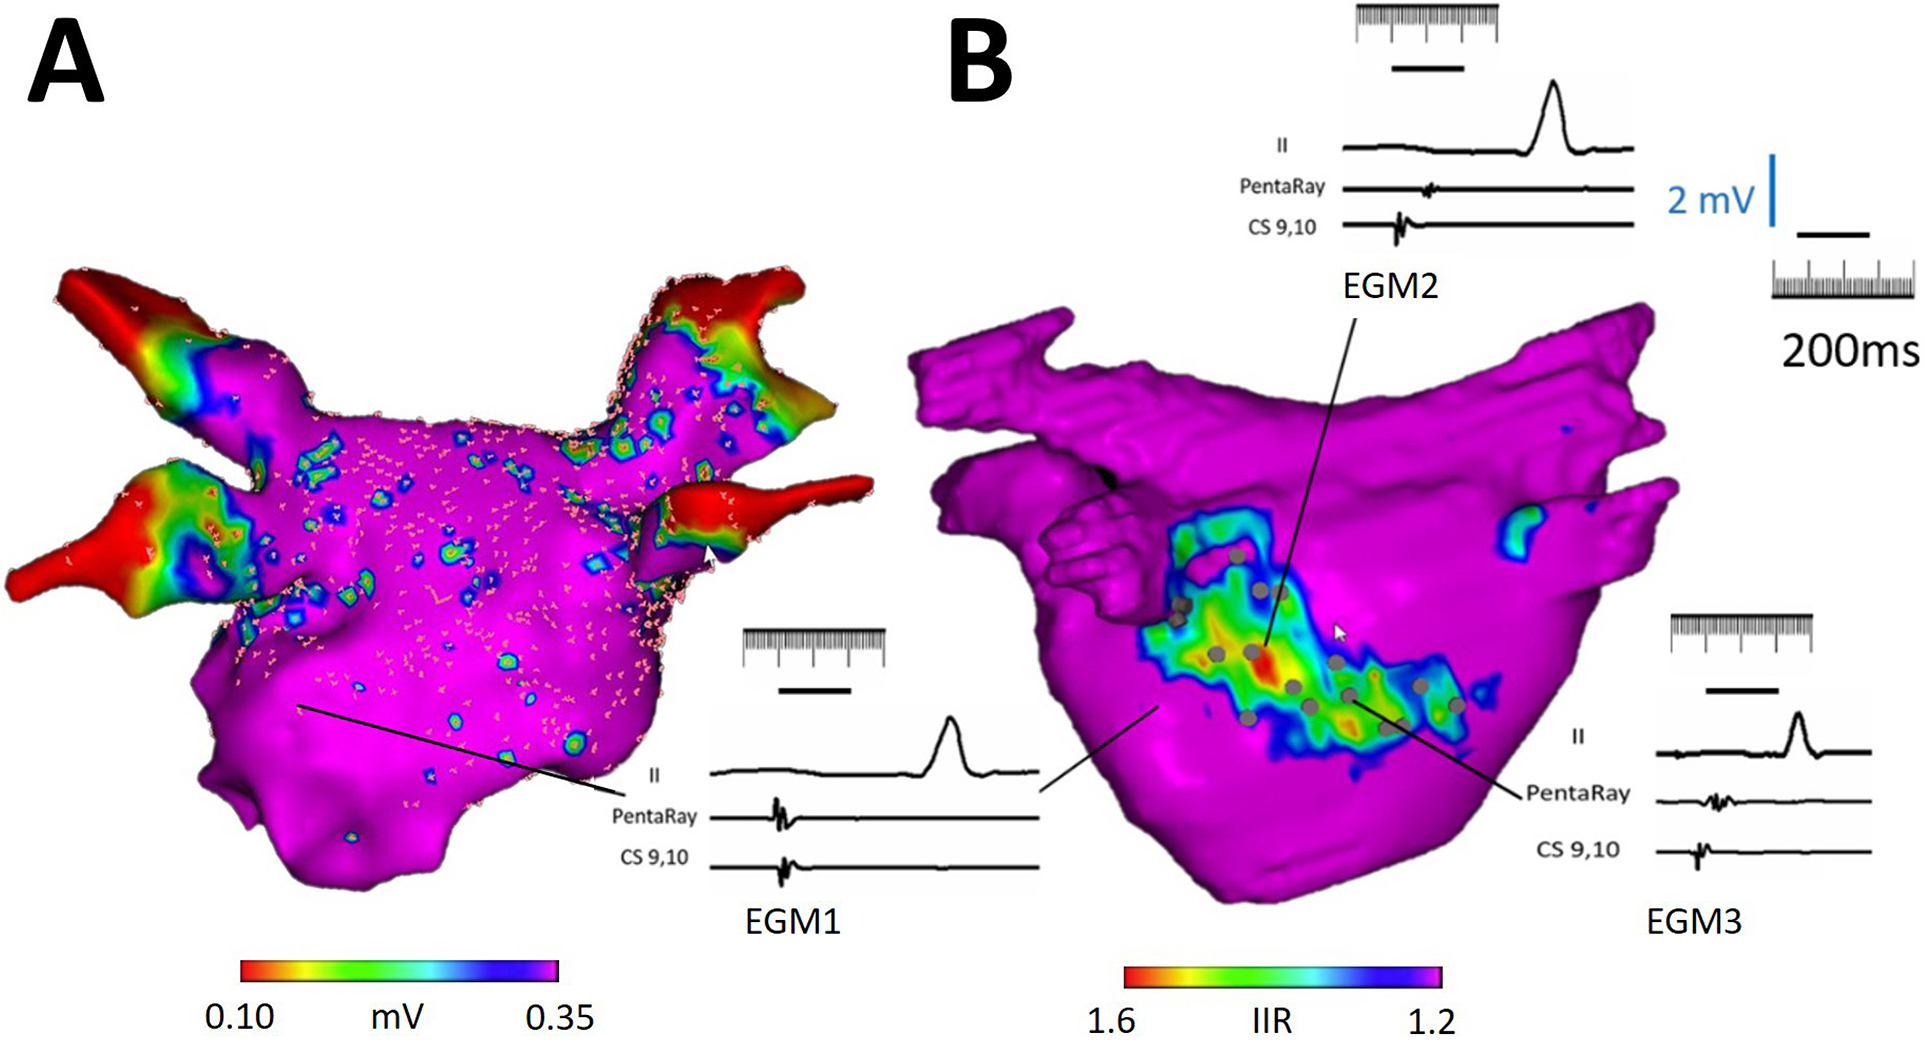
Figure 3.

Illustration of CMR LGE-detected atrial substrate and EGM characteristics. (A) The panel shows a postero-anterior view of a left atrial bipolar voltage map, which is registered to the left atrial CMR segmentation from panel B. Note that the voltage map shows no significant cohesive low amplitude areas within the left atrial body. (B) The panel demonstrates the left atrial CMR segmentation with color thresholds defined by image intensity ratio (IIR) from the same patient. The bipolar voltage map from panel A is hidden. Electrograms acquired from points corresponding to predefined IIR thresholds are displayed. A normal EGM is noted in a region with IIR < 1.2 as EGM 1. A delayed and fractionated EGM with borderline low voltage is noted in a region with IIR > 1.6 as EGM 2. Importantly, a large region with intermediate IIR (between 1.2 to 1.6) displayed normal bipolar voltage (>0.50mV) with fractionated EGMs suggestive of electrical disease (EGM 3).
