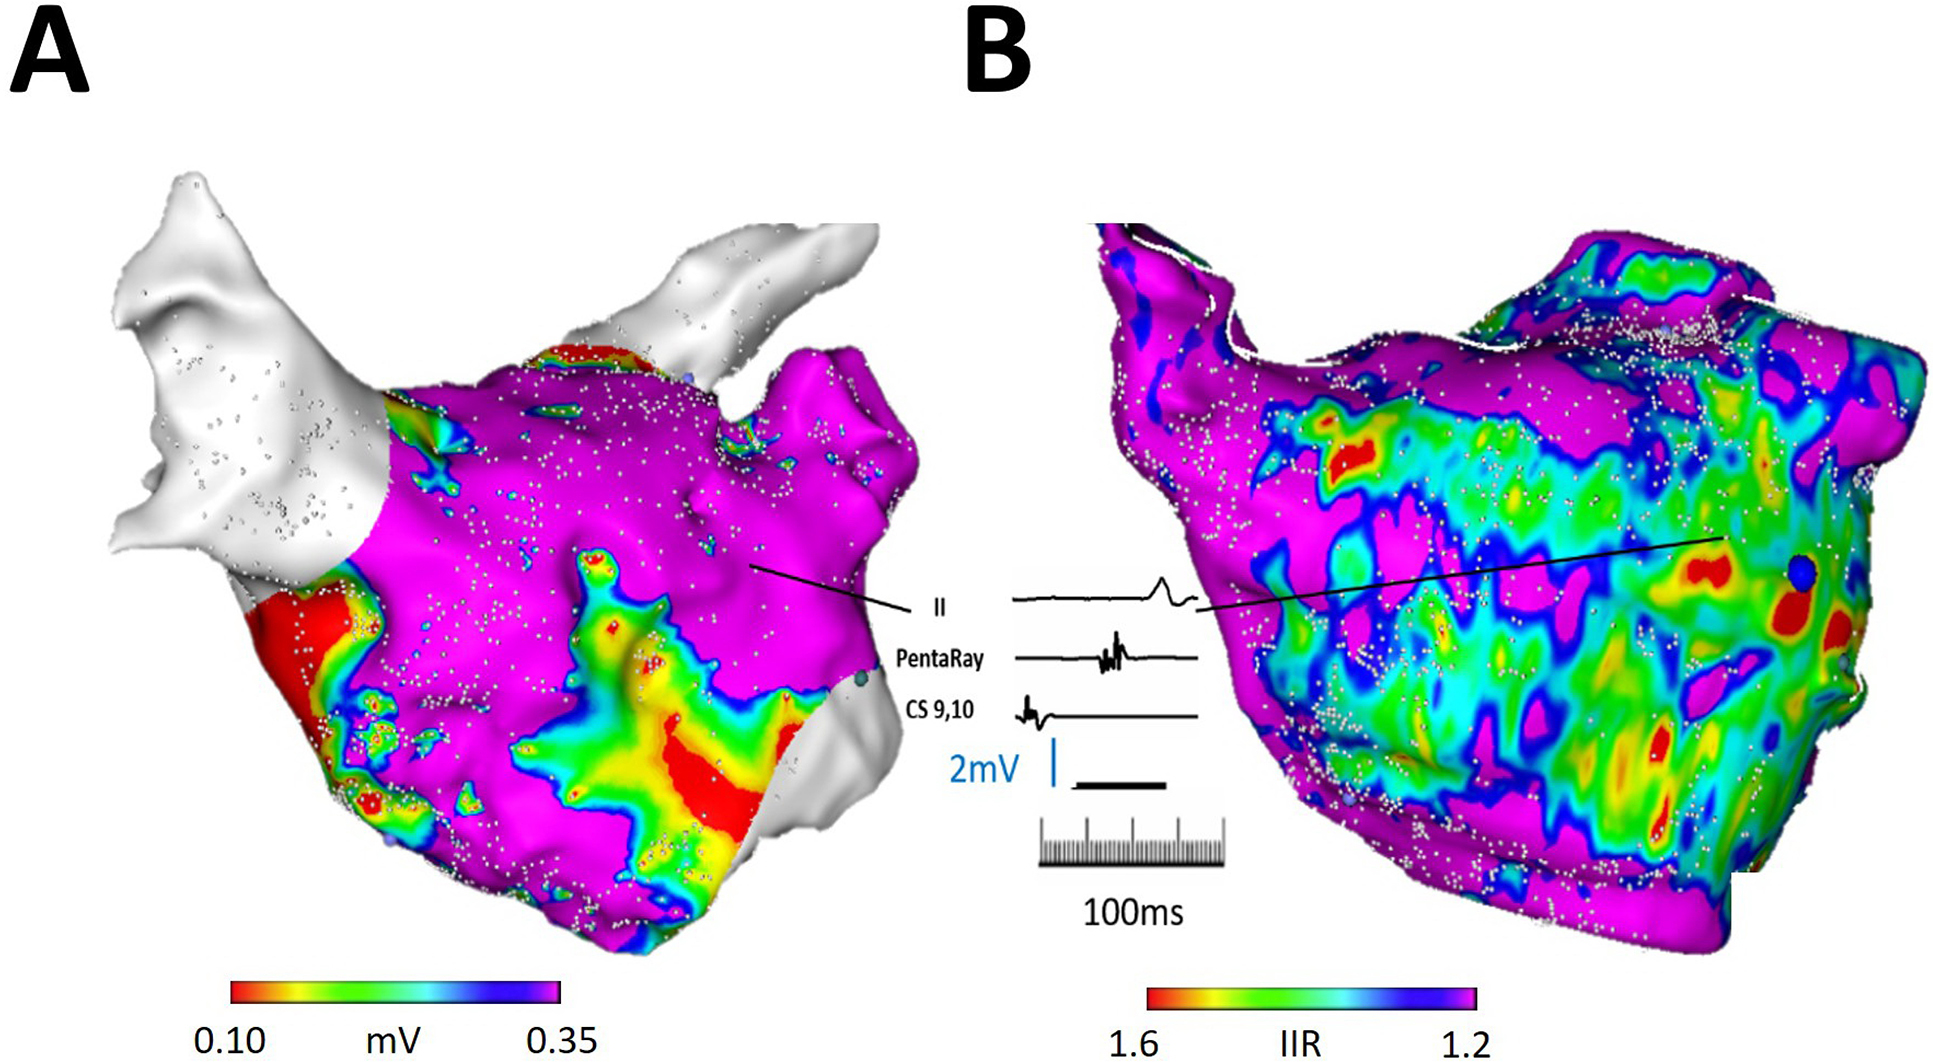
Figure 4.

Illustration of CMR LGE-detected atrial substrate and EGM characteristics. (A) The panel demonstrates an anteroposterior view of an electroanatomic left atrial map in a patient with prior pulmonary vein isolation. Regions with low voltage are noted surrounding but not encircling the pulmonary veins, as well as in the septal peri-mitral area. (B) The panel demonstrates left atrial CMR segmentation from the same patient with color thresholds defined by IIR in the same orientation as in panel A. A representative electrogram acquired from a point corresponding to IIR between 1.2–1.6 and normal bipolar voltage (1.38mV) demonstrates fractionation and >80 ms delay compared to the proximal coronary sinus signal suggestive of electrical disease.
