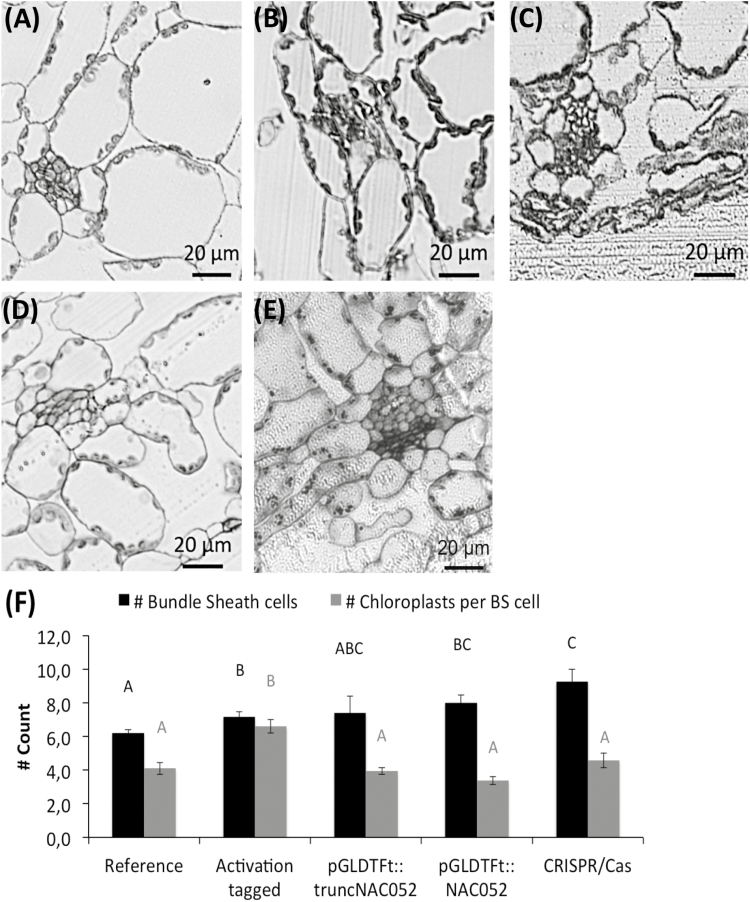
Fig. 4.
Light micrographs illustrating transverse cross-sections of a third-order vein. (A) Reference line, (B) activation-tagged line, (C) pGLDTFt::5'truncatedNAC052 line, (D) pGLDTFt::NAC052 line, (E) CRISPR/Cas line. (F) Quantification of the number of BS cells and the number of chloroplasts per BS cell. Letters indicate statistically significant differences as determined by ANOVA (n=5; P<0.05)

