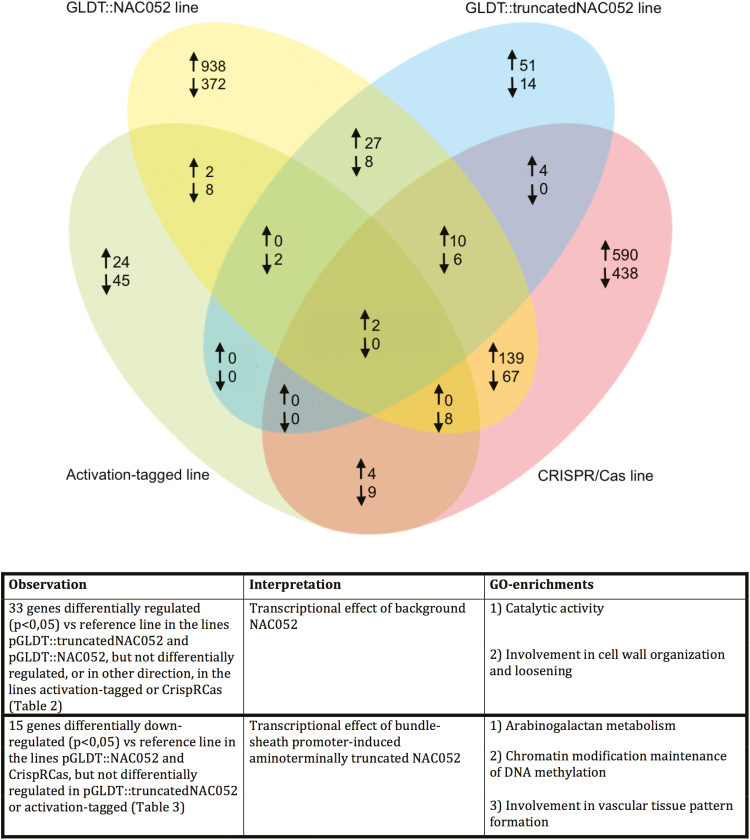
Fig. 5.
Number of genes with a differential transcript count compared with the pGLDPAFt::RbcS.TP-sGFP reference line. Venn diagrams displaying the number of significantly (P=0.05) differentially (>2.0-fold up- or down-regulated) expressed genes when comparing the pGLDTFt::NAC052, pGLDTFt::5'truncatedNAC052, activation-tagged, or CRISPR/Cas transformed line with the reference line. The panel gives an overview of the GO enrichments.

