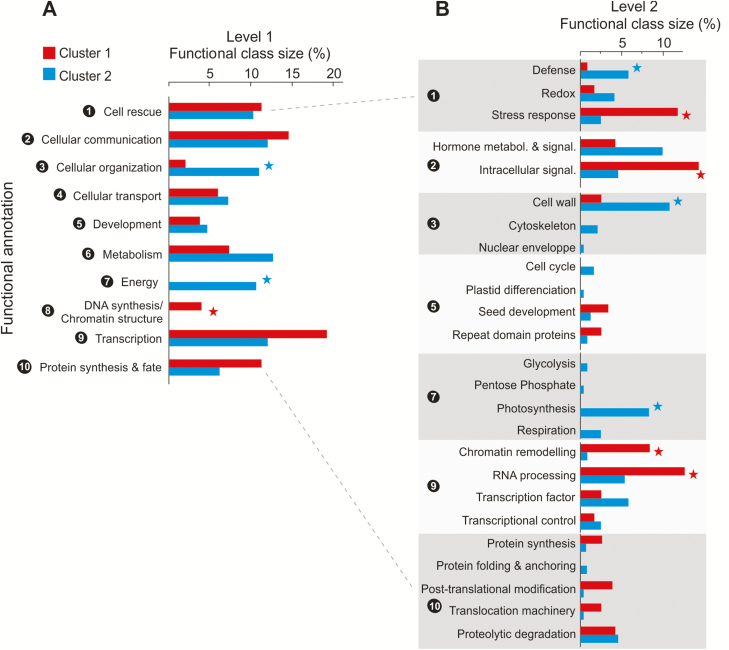
Fig. 5.
The percentage of candidate genes in clusters 1 (red) and 2 (blue) that belong to each functional class. Class sizes that are significantly different between the two clusters (χ 2 test, P-value<0.05) are indicated with asterisks. (A) The first level of functional terms; (B) the second level of functional terms. Functional terms that are child terms of the first level are separated and numbered for ease of visualization.

