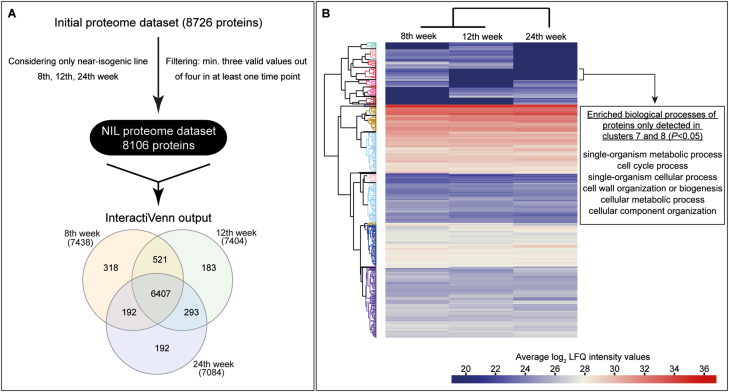
Fig. 3.
Generation of a temporal proteomic map of Taraxacum koksaghyz roots. (A) The filtering procedure used to obtain the proteome dataset of the latex-exuding near-isogenic line (NIL). The Venn diagram illustrates the distribution of the dataset across the three time-points at which sampling was conducted. (B) For hierarchical cluster analysis the mean Log2 Label-Free Quantification (LFQ) intensities per time-point were calculated and compared. Based on all proteins, 42 clusters were calculated to assemble proteins together that possessed a similar expression pattern and strength, as depicted in the tree. The cluster allocations of the whole dataset are given in Supplementary Fig. S4 and Supplementary Table S5. In the example shown, a GO enrichment analysis was conducted for clusters 7 and 8 to identify the corresponding biological processes using the functional annotation tool from DAVID. GO terms with a P<0.05 are depicted (see also Supplementary Table S14).

