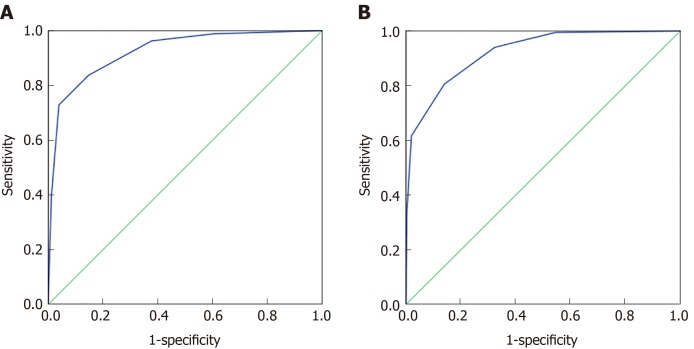
Figure 3.
Classification tree analysis results of colorectal cancer and healthy control group, malignant disease group and benign disease group. A: ROC curve of the classification tree analysis model of the colorectal cancer and healthy control group, respectively; B: ROC curve of the classification tree analysis model of the colorectal cancer and healthy control group.

