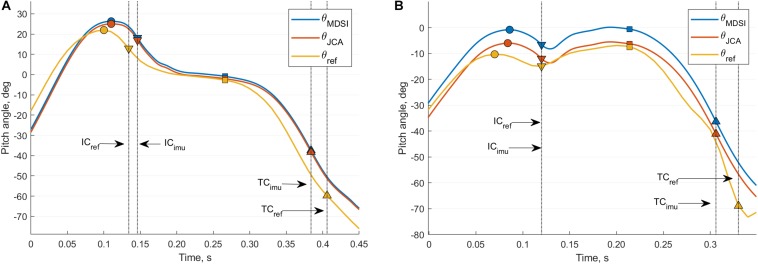
FIGURE 3.
Comparison of the pitch angle measured from different measurement systems for a rearfoot (A) and forefoot (B) striker. The blue curve is the estimation from the IMU-based MSDI method (θMSDI), the orange curve from the IMU-based JCA method (θJCA), and the yellow curve from the reference motion tracking system (θref). The IC events are shown using down-pointing triangles, TC events with up-pointing triangles, MS events with squares, and the AC peaks using circles. The black vertical dashed lines accentuate the detection differences, for the IC and TC events, between the IMU and the FP system.

