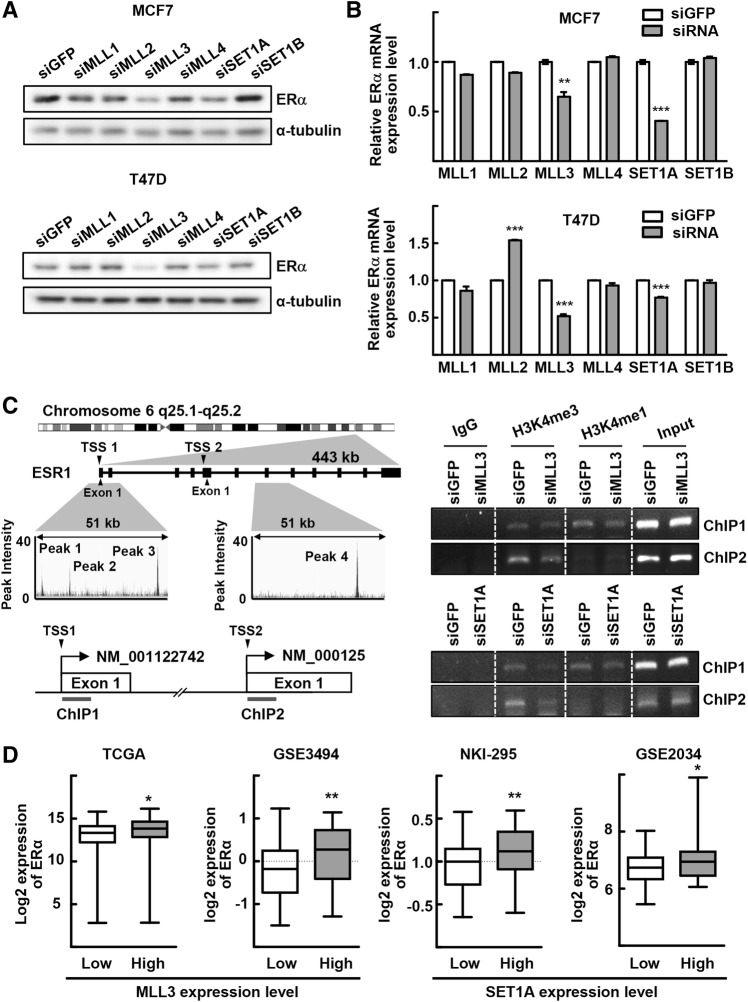
Fig. 2.
MLL3 and SET1A regulate ERα gene expression. a, b The MCF7 and T47D cells were transfected with indicated siRNA for 48 h. Total whole cell lysates and RNA obtained from MCF7 and T47D cells were subjected to western blotting (a) and qRT-PCR analysis (b), respectively. Data presented as mean ± SEM (n = 3). **P < 0.01 and ***P < 0.001. c Integrative Genomics Viewer tracks showed four MLL3 binding peaks in the ERα promoter/enhancer regions which was generated based on the analysis of the MLL3 ChIP-seq data set (GSE81714). Boxes and lines in the ESR1 gene represent exons and introns, respectively (left top). Schematic representation of the human ERα promoter/enhancer regions for ChIP experiments (left bottom). MCF7 cells were transfected with siMLL3 or siSET1A for 48 h. DNA fragments that were immunoprecipitated by anti-H3K4me3 or anti-H3K4me1 antibodies were amplified by PCR using primers for ChIP1 and ChIP2 (right). TSS: transcriptional start site. d The mRNA expression of ERα and MLL3 in ER-positive breast cancer patients are based on TCGA RNA-seq or GSE3494 microarray data set (https://xena.ucsc.edu/) [33]. The mRNA expression of ERα and SET1A in ER-positive breast cancer patients are based on GSE2034 microarray data set or NKI microarray data set (https://xena.ucsc.edu/) [34, 35]. Patients were categorized into a low gene expression (lower quartile) group and a high gene expression (upper quartile) group. TCGA RNA-seq: n = 150 for MLL3-low and n = 150 for MLL3-High; GSE3494 microarray: n = 62 for MLL3-low and n = 62 for MLL3-High; NKI-295 microarray: n = 56 for SET1A-low and n = 56 for SET1A-High; GSE2034 microarray: n = 52 for SET1A-low and n = 52 for SET1A-High. *P < 0.05 and **P < 0.01

