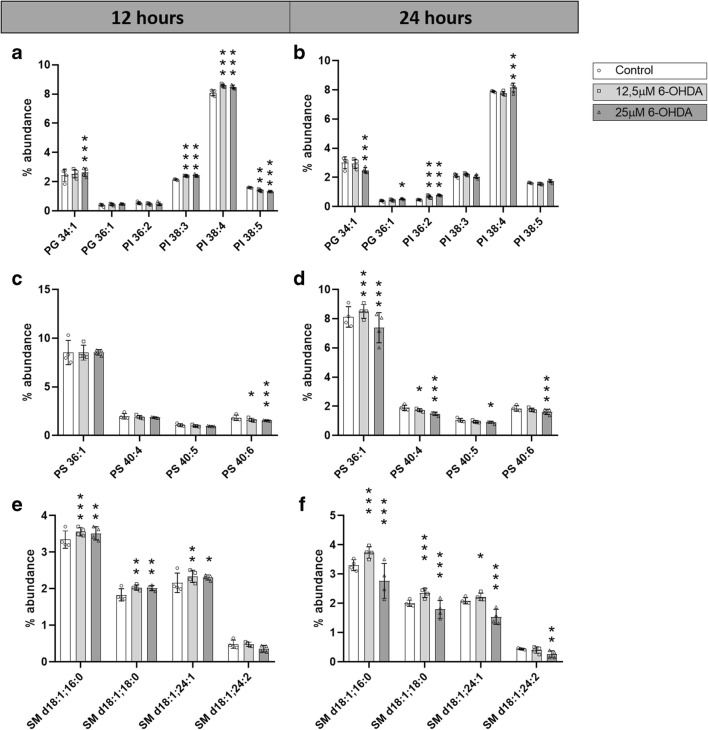
Fig. 4.
Abundance of specific PG, PI, PS, and SM species. Percentage of abundance of individual PG and PI species after a 12 h and b 24 h of treatment with 0 μM, 12.5 μM, or 25 μM 6-OHDA. Percentage of abundance of individual PS species after c 12 h and d 24 h of treatment with 0 μM, 12.5 μM, or 25 μM 6-OHDA. Percentage of abundance of individual SM species after e 12 h and f 24 h of treatment with 0 μM, 12.5 μM, or 25 μM 6-OHDA N = 4. Dunnett corrected p values of differences relative to the control. *p < 0.05; **p < 0.01; ***p < 0.001

