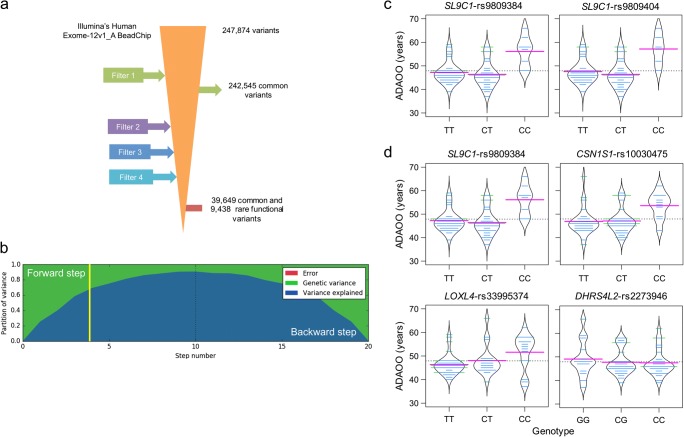
Fig 1.
a Filtering process applied to exonic variants. Filter 1 includes common variants between the Illumina’s Human Exome-12V1_A BeadChip and the whole-exome capture. Filter 2 excludes variants with a genotype call rate < 90%, in Hardy-Weinberg disequilibrium and with one or > 2 alleles. Filter 3 excludes variants with MAF < 1% and Filter 4 excludes those nonfunctional. A total of 49,087 CEFVs remained for analysis. b Partition of phenotypic variance for each forward inclusion (steps 1 to 10) and backward elimination (10 steps after the dotted line). The yellow vertical line marks the selected model based on the highest multiple posterior probability of association (mPPA). Beanplots for ADAOO as a function of genotypes in variants with PFDR < 0.05 when c single- and d multi-locus linear mixed-effects models were used (see Table 1). Pink, blue, and dotted horizontal lines correspond, respectively, to the within genotype average ADAOO, the individuals’ ADAOO, and the global average ADAOO in our sample of 71 PSEN1 E280A mutation carriers. ADAOO, Alzheimer’s disease age of onset; CEFVs, common exonic functional variants

