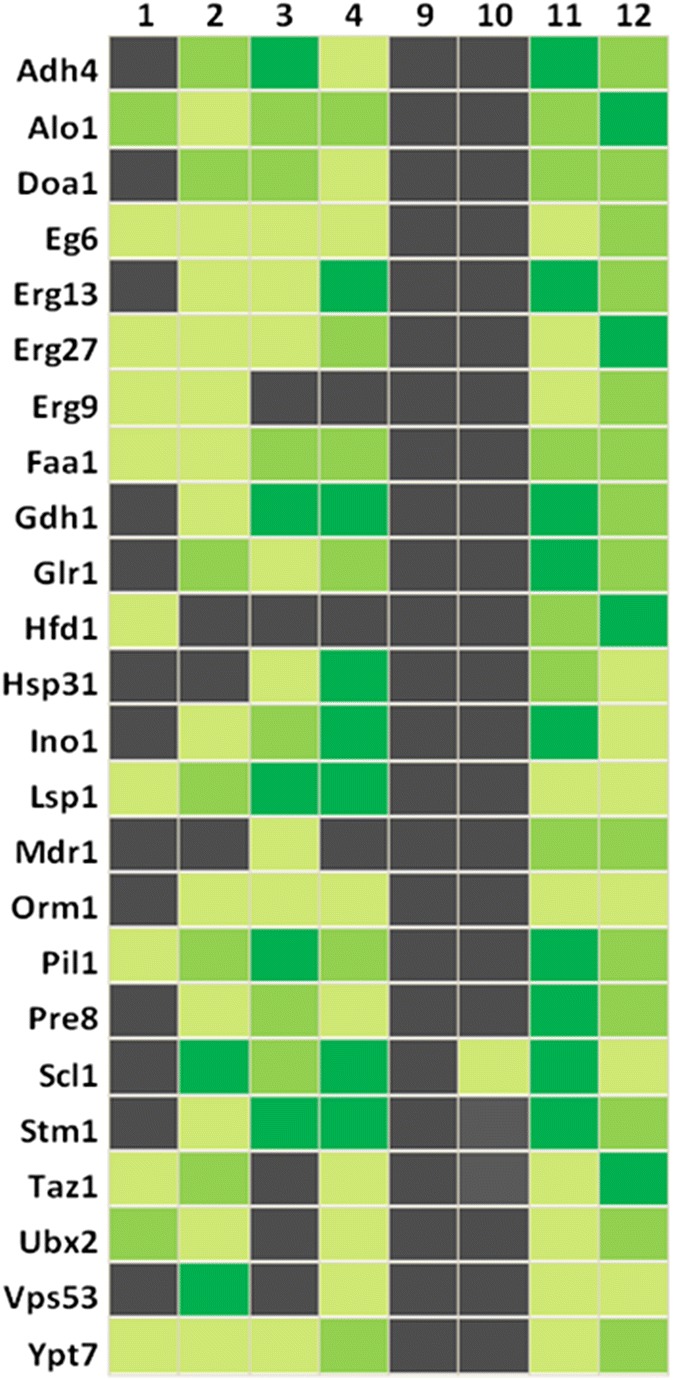
Fig. 5.

Heatmap of selected protein localizations. Black indicates the absence or near absence of proteins. Different shades of green represent various amounts of proteins, from light green (low abundance) to dark green (high abundance). 1: Mitochondria from BY4741; 2: Mitochondria from replicatively aged BY4741 cells; 3: Mitochondria from stressed cells (BY4741 pCM666 + 200 mg/l doxycycline); 4: Mitochondria from apoptotic cells (BY4741 pCM666-mBAX +200 mg/l doxycycline); 9: LDs from BY4741; 10: LDs from replicatively aged BY4741 cells; 11: LDs from stressed cells (BY4741 pCM666 + 200 mg/l doxycycline); 12: LDs from apoptotic cells (BY4741 pCM666-mBAX +200 mg/l doxycycline)
