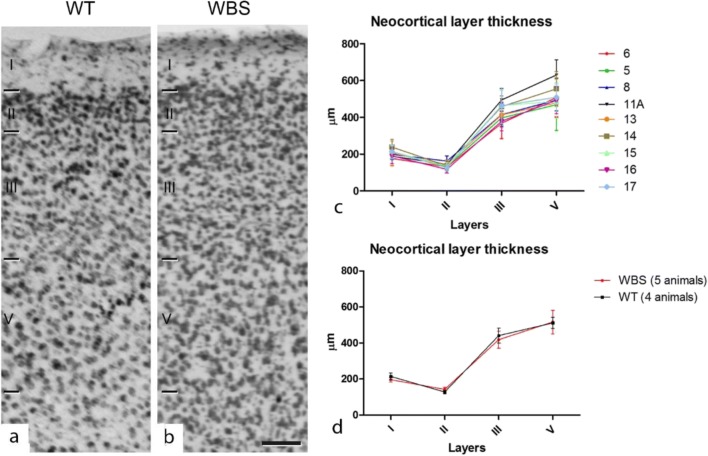
Fig. 1.
Cortical lamination of frontal association area in WT and WBS mice. Photomicrographs from Nissl-stained sections through the frontal association cortex of WT (a) and WBS (b) mice showing the limits between cortical layers. Scale bar indicates 95 μm. c, d Line graphs showing the lack of differences in layer thickness between WT and WBS mice

