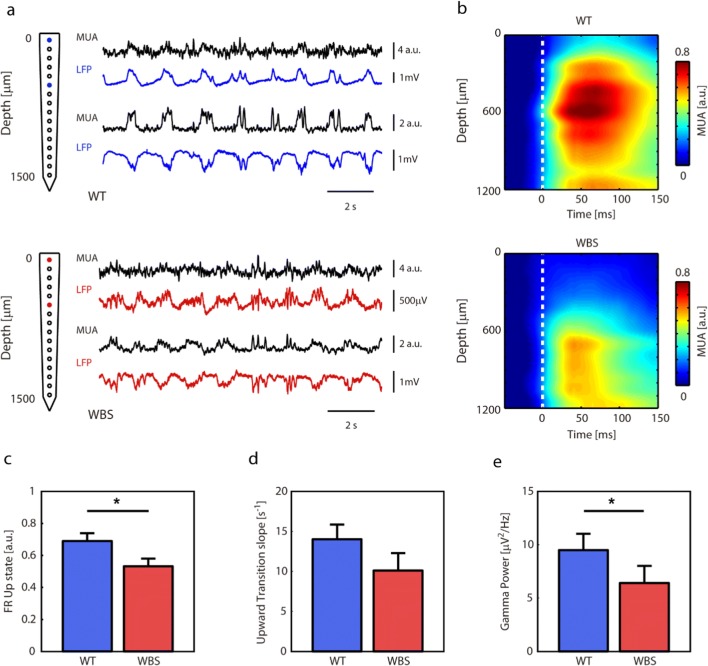
Fig. 2.
In-depth recordings from frontal association area in WT and WBS mice. (a) Electrophysiological recordings from WT (top) and WBS (bottom) representing slow oscillatory activity (MUA, LFP) at two depths (0 and 500 μm). (b) Grand average of MUA with respect to depth (NWT = 9, NWBS = 8). (c) Frequency of occurrence of the Up states in WT and WBS mice (p = 0.0360, Mann–Whitney U test). (d) Down to Up slope (indicating speed of recruitment of the local network) in WT and WBS mice (p = 0.1672, Mann–Whitney U test). (e) Gamma power in the power spectrum density (32–100 Hz) (p = 0.0464, Mann–Whitney U test)

