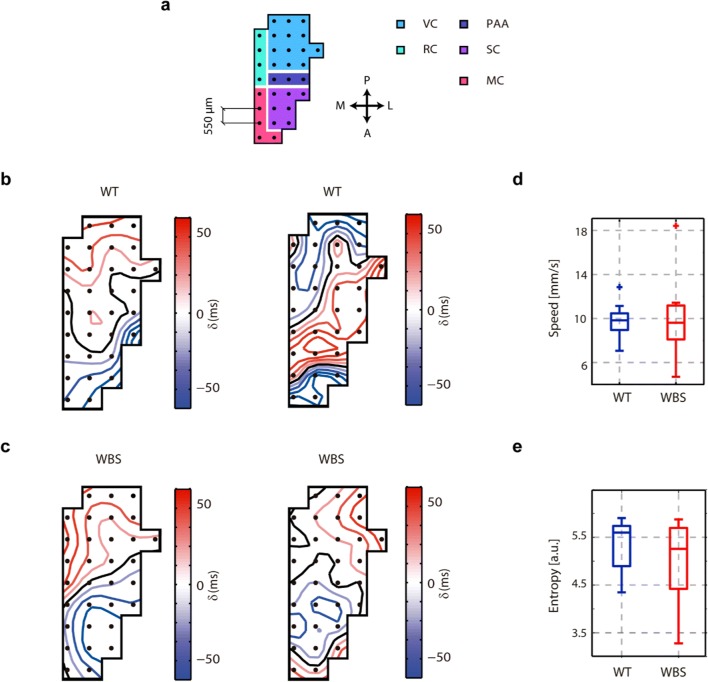
Fig. 3.
Slow-wave propagation in the cortical surface in WT and WBS mice. (a) Scheme of the superficial 32-channel electrode array. In colors, the areas covered by the array according to the stereotaxic coordinates (VC=visual cortex, RC=retrosplenial cortex, PAA=parietal association area, SC=somatosensory cortex, MC=motor cortex; P=posterior, A=anterior, L=lateral, M=medial) (b) Example of two spatiotemporal patterns of wave propagation in WT animals. The color scale represents the time delays in milliseconds. (c) Example of two spatiotemporal patterns of wave propagation in WBS animals, color code as in panel b. (d) Box plots of the average absolute speed of propagation across the experiment in WT and WBS animals. (e) Box plots of the entropy of the spatiotemporal patterns of the waves in WT and WBS animals. No differences were found between WT and WBS animals

