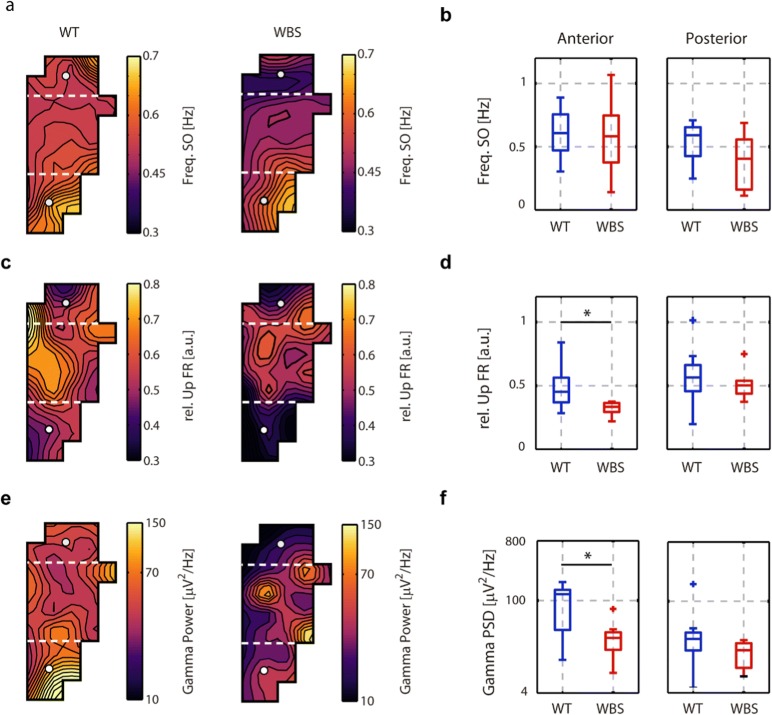
Fig. 4.
Superficial distribution of SO parameters in WT and WBS mice. (a, c, e) 2D interpolation of the SO frequency, FR of the Up state relative to the Down state, and gamma power, respectively, in the 32-channel array for the mean population of all WT (N = 9) and WBS (N = 8) mice. Dashed white lines delimit the anterior and posterior regions represented in the boxplot. (b) Mean frequency SO values for the anterior and posterior regions in all WT and WBS mice. No significant differences were found. (d) Box plots of the mean relative FR of the Up state for the anterior (p = 0.008, Mann–Whitney U test) and posterior regions. (f) Box plots of gamma power (32–100 Hz) for the anterior (p = 0.0015, Mann–Whitney U test) and posterior regions

