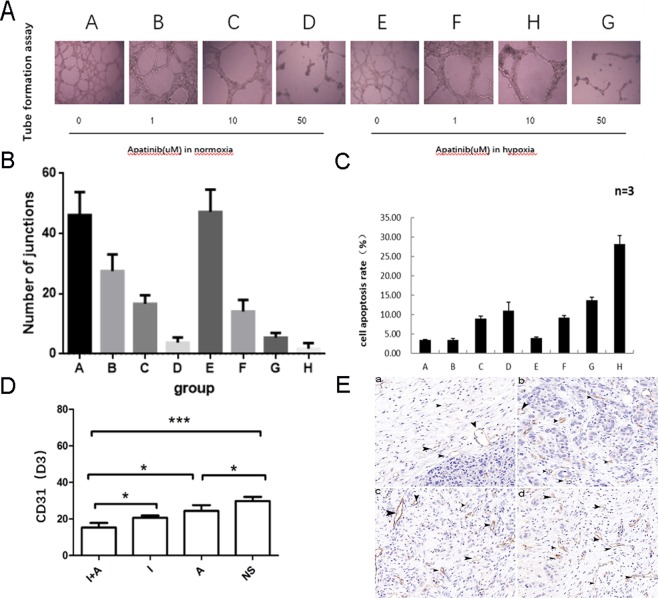
Figure 2.
Apatinib significantly suppressed angiogenesis of tumor cells in a dose-dependent manner (A–D). (A) The tube formation of HUVECs with different concentrations of Apatinib under normoxic or hypoxic conditions. (B) The number of junctions of each group. Apatinib could inhibit the HUVECs proliferation at a very low dose (0.1 uM), especially in the hypoxic environment, P > 0.05 in group A vs E and P < 0.05 in group B vs F, C vs G, D vs H. (C) The cell apoptosis rate of HUVECs with with different concentrations of Apatinib under normoxic or hypoxic conditions, P > 0.05 in group A vs E and P < 0.05 in group B vs F, C vs G, D vs H. (D) CD31 in VX2 tumor tissues was markedly inhibited by Apatinib in Day 3 (D3), the CD31 of group AI was lower than that of group I (P = 0.027 < 0.05). (E) Images of MVD in each group was shown by light microscopy (CD31 staining, 200×), a-Group AI, b-Group I, c-Group A and d-Group NS. Stripe and annular microvessels (black arrows) were observed in all the four groups, the MVD in Group AI was significantly lower than the other groups. Each point represents the mean ± SD (n = 3). *P < 0.05, ***P < 0.001.

