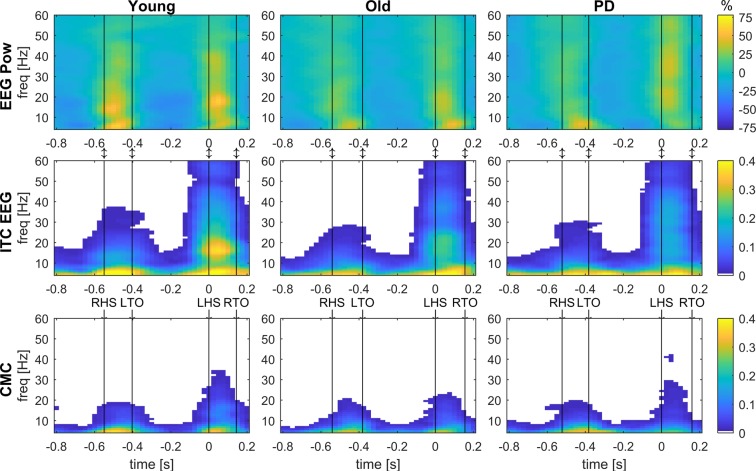
Figure 1.
Grand-average time-frequency spectra of EEG power, inter-trial coherence and corticomuscular coherence. Event-related EEG power (EEG Pow, top row), inter-trial coherence of EEG (ITC EEG, middle row) and corticomuscular coherence (CMC, bottom row) acquired from bipolar EEG signals of the right sensorimotor cortex (C4-F4) and EMG from the left TA during overground walking in the young, old and PD groups. EEG power shows the percent change from the average. Coherence values (ITC and CMC) are thresholded: average coherence values below the 95% CI are set to zero (white). The x-axis shows the time in seconds relative to heel strike (t = 0) of the left foot and the y-axis the frequencies in Hz. Black vertical lines indicate the footswitch events. LHS, left heel strike; LTO, left toe-off; RHS, right heel strike; RTO, right toe-off.

