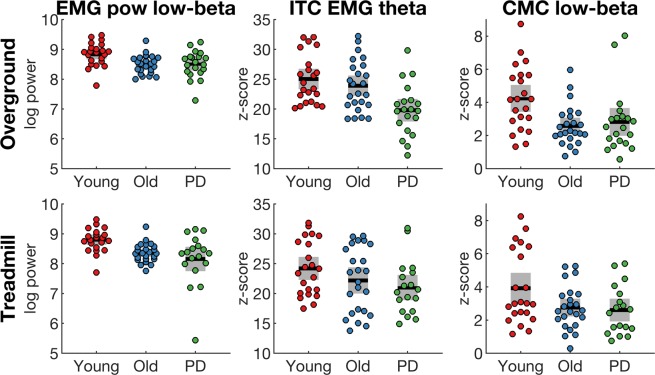
Figure 3.
Spectral measures that reveal significant main effect of group. Spectral measures were averaged over double support in different frequency bands for each group (young, old, PD). EMG power at low beta frequencies (EMG pow, first column), EMG inter-trial coherence at theta frequencies (ITC EMG, second column), corticomuscular coherence at low beta frequencies (CMC, third column) during overground (top row) and treadmill (bottom row) walking. Data derived from bipolar EEG signals of the right sensorimotor cortex (C3-F3) and EMG from the left TA. Coloured dots show individual data of each participant, black horizontal lines show the group mean, grey boxes show the SEM.

