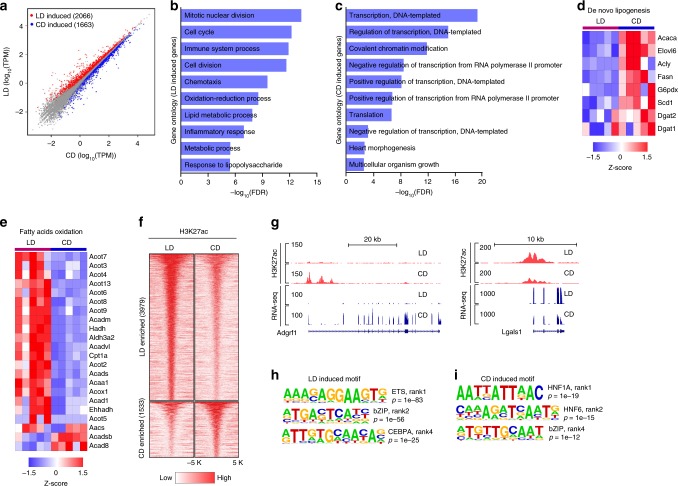
Fig. 2. Chronic obesity reprograms the liver transcriptome and enhancer network.
a Scatter plot of RNA-seq data in mice on CD or LD. Upregulated transcripts are those higher in LD (LD induced). Downregulated transcripts are those higher in CD (CD induced). b, c Pathway analysis of LD/CD induced genes. d, e Heatmap of key genes involved in de novo lipogenesis or in fatty acid oxidation. Each column contains data from an individual study animal, each row represents a gene. f Heatmap of H3K27ac differentially enriched regions in LD and CD (n = 3 per group). Each row in the heatmap represents an individual differentially acetylated locus. LD induced loci represent loci with higher acetylation status in lipid-rich diet. CD induced loci represent loci with higher acetylation status in CD condition. g Example of an H3K27ac differentially enriched region. Left panel depicts the Adgrf1 locus which has higher acetylation and transcript levels on CD. Right panel depicts the Lgals locus which has higher acetylation and transcript levels on LD. h, i Motifs enriched in LD or CD induced H3K27ac differentially enriched regions. ∗∗∗∗p < 0.0001.

