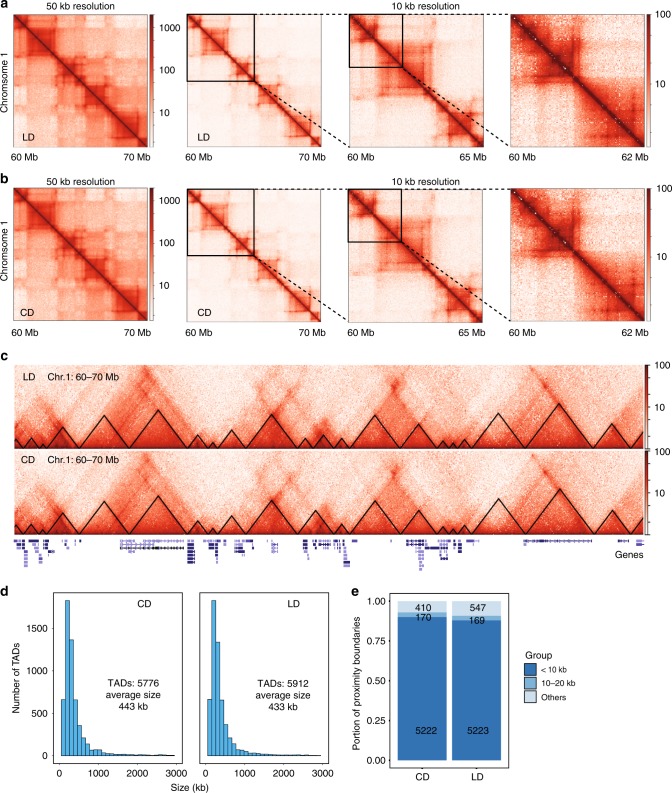
Fig. 3. High order chromatin organization in liver during chronic obesity.
a, b Hi-C contact matrix depicting normalized contact frequencies in carbohydrate-rich diet (CD, Panel a) or lipid-rich diet (LD, Panel b) group at 50 and 10 kb bins (n = 2 per group). Examples at Chr1: 60–70 Mb. c Examples of TADs (Black triangle represents the TAD) and genes in Chr1: 60–70 Mb in LD and CD group. d Histograms of distribution of sizes of the TADs in CD and LD group. e Percentage of proximity TAD boundaries in CD and LD group.

