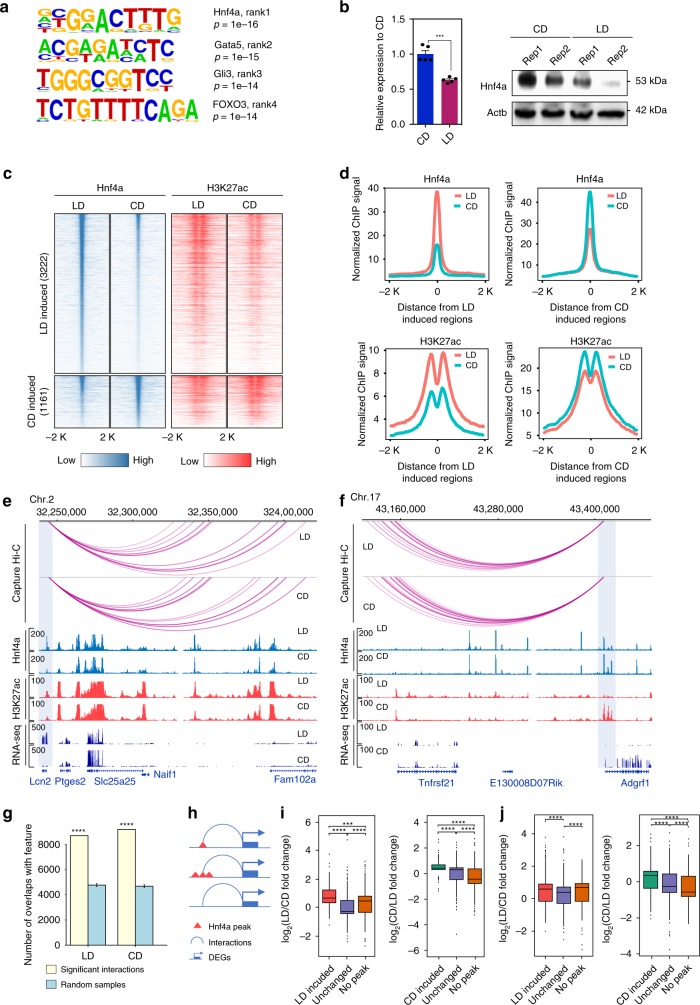
Fig. 6. Transcriptome analysis links Hnf4α to regulation of metabolism genes in NAFLD.
a Motifs enriched in the promoters of differentially expressed genes. b Abundance of Hnf4α at the transcript (left panel) and protein levels (right panel) in carbohydrate-rich diet (CD) or lipid-rich diet (LD) group. The column graph depicts mean and SEM (n = 5 animals). Significance is indicated (two-tailed t test). c Heatmap of Hnf4α differentially bound regions. Acetylation status at the same loci is indicated in the right-hand panel. d Metagene plot of Hnf4α and H3K27ac signal at differentially bound regions. e, f Example of differential binding of Hnf4α and acetylation at H3K27 at the Lcn2 and Adgrf1 loci. Regions with differential Hnf4α binding are indicated with blue shading in the figure. g Overlap of Hnf4α with the distal end of promoter/enhancer interactions compared with random samples. Significance is indicated in the figure (Chi square test). h Schematic overview of diet-induced Hnf4α binding at interactions. i Box and whisker plots showing changed gene expression as a function of diet-induced Hnf4α binding at promoter interactions. Box denotes 25th to 75th percentile, horizontal bar is median, whiskers extend to 1.5*IQR beyond the box. j Box and whisker plots showing changed gene expression as a function of diet-induced Hnf4α binding near a TSS (+/−50 kb). Box denotes 25th to 75th percentile, horizontal bar is median, whiskers extend to 1.5*IQR beyond the box. Significance (Mann–Whitney U test) is indicated in the figure. ∗∗∗p < 0.001, ∗∗∗∗p < 0.0001.

