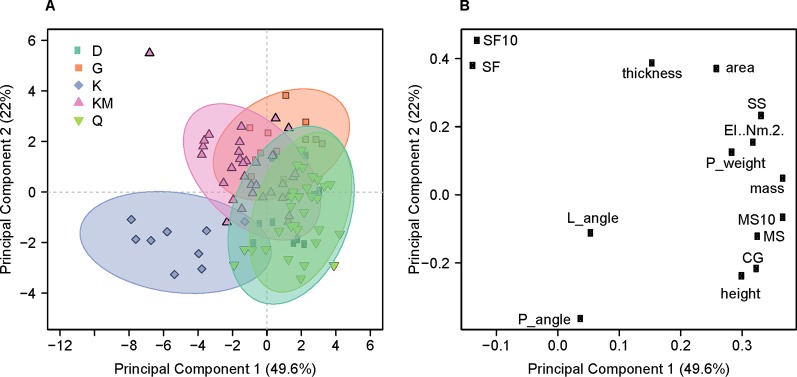
Figure 5.
Principal Component Analysis for the top two components. (A) Scores of the first two principle components colored by genotype. Quncho (Q): green; Dukem (D): teal; kinde (K): purple; Key Murrie (KM): pink; and Gommadie (G): orange are shown for the 95 observations which had measurements for both panicle angle and panicle weight. Significant overlap is seen for Quncho and one of its parents, Dukem. Kinde is separated on both principle components. (B) Loadings of the first two principle components. Panicle angle (P_angle) is highly correlated with lodging angle (L_angle). In a correlation circle plot, the angle formed by any two variables and the origin reflects their pairwise correlation.

