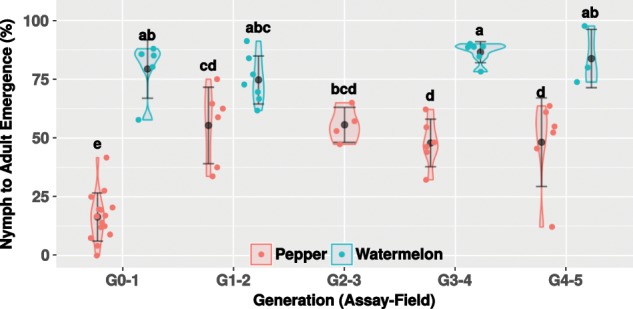
Fig. 5. Performance (egg-to-adult survival) of the field populations on their respective host plant, under controlled environment, along four generations.

Data from two (G1–2 to G4–5) and five (G0–1 as performance baseline, recorded each generation) independent experiments are represented as violin plots, with each dot representing whiteflies’ performance on single leaves (three leaves in average per plant). Average survival and standard deviation are denoted by filled black dots and whiskers, respectively. Letter/s above each violin plot indicate/s the significance of the differences after conducting a Tukey’s HSD test. The G0–1 assay, which is the first time the starting population was transferred to the field plots, correlated with the first generation that have developed in the field (P1 or W1). Similarly, the G1–2 assay correlated with the second generation that have developed in the field (P2 or W2).
