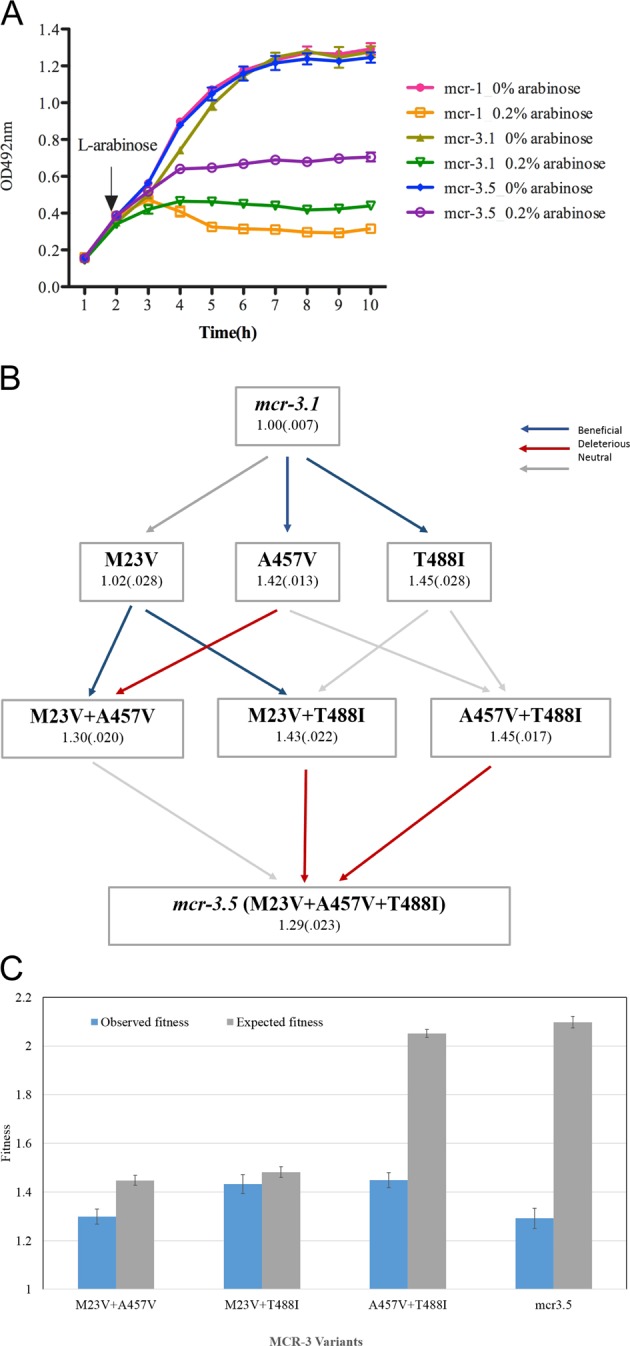
Fig. 1. The competitiveness and fitness landscape of mcr-3 variants.

a Effects of the expression of three mcr-variants, mcr-1, mcr-3.1 and mcr-3.5 on bacterial growth rate in vitro. The expression of mcr- genes was induced by 0.2% (w/v) L-arabinose and bacterial density was measured by microplate reader at every 1 h. The data represent the mean and SD (n = 3). b The adaptive landscape of colistin resistance mcr-3.5 conferred by three mutations in mcr-3.1 gene. Each node displays the amino acid substitution (M23V, A457V and T488I) and its average fitness. This figure shows the fitness landscape connecting MCR3.1 to MCR3.5. Possible evolutionary trajectories are shown with arrows and the fitness of each genotype is given followed by the standard error of fitness. We tested the fitness effect of each mutation using a t-test followed by a Bonferroni correction for multiple (n = 12 tests). Blue and red arrows show mutations that significantly increase or decrease fitness, respectively, and grey arrows show neutral mutations that do not alter fitness (details in Supplementary Table 6). c Epistatic interactions among MCR-3 mutants: this figure shows the observed (blue) and expected (grey) fitness of MCR mutants containing at least two substitutions (+/− S.E). Expected fitness values were calculated using a multiplicative model of fitness and we used the method of propagation of errors to determine the error in expected fitness estimates (Supplementary Table 7).
