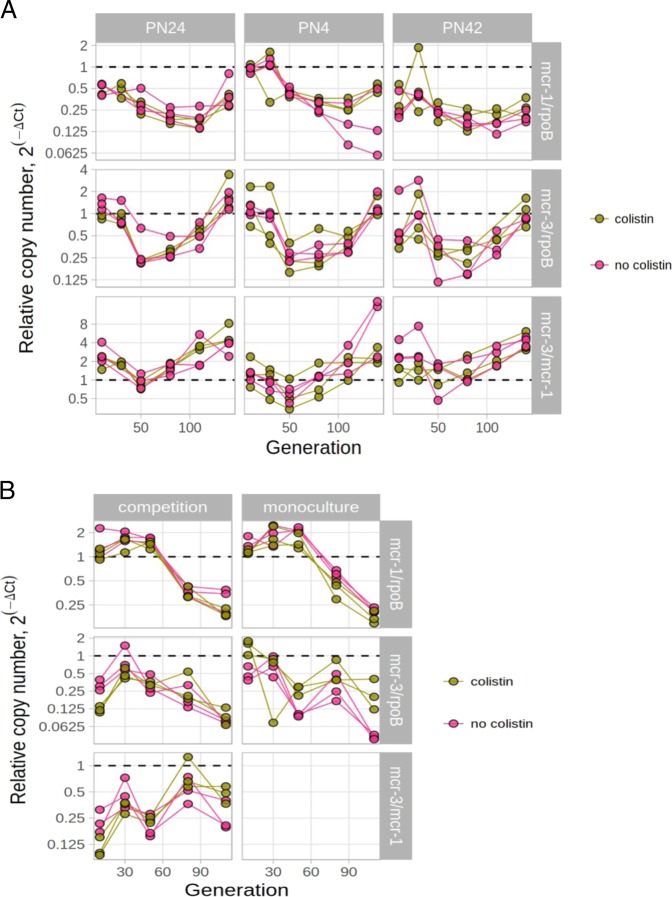
Fig. 2. The abundance of mcr-1 and mcr-3 plasmids in two competition models.
a The dynamic changes of mcr-1 and mcr-3 plasmids’ copy numbers in wild-type strains. To model the change in mcr-1 or mcr-3 copy number across time, we used polynomial regression. The difference in threshold cycle (ΔCt) between either mcr-1 or mcr-3 and chromosomally encoded gene rpoB were used to calculate their relative copy numbers over time (see Methods in Supplementary File 1). In addition, the difference in threshold cycle (ΔCt) between mcr-3 or mcr-1, which is equivalent to log2 of relative copy number, were used as a response variable. In this figure, four fixed variables and their interactions were used as predictors: Strain (PN42, PN4 or PN24), genes (mcr-1 and mcr-3), generations and Colistin (colistin presence/absence). Each strain included three independent replicates which were measured repeatedly over the course of the experiment. For a full model incorporating the effect of host strain, particular gene and presence of colistin, see Supplementary Tables 9–13. The analysis was performed using R (version 3.5.1) and packages lme4 (version 1.1–17) and lmerTest (version 3.0-1). b The dynamic changes of mcr-1 and mcr-3 genes/plasmids in E. coli J53 strain. We used threshold cycle values (CT) measured by qPCR in order to estimate relative copy number (see Methods). Two fixed variables and their interactions were used as predictors in this figure: cultures (monoculture vs mixed cultures), genes (mcr-1 and mcr-3), generations and Colistin (colistin presence/absence). For a full model incorporating the effect of culture, particular gene and presence of colistin, see Supplementary Tables 13–15. The analysis was performed using R (version 3.5.1) and packages lme4 (version 1.1-17) and lmerTest (version 3.0-1).

