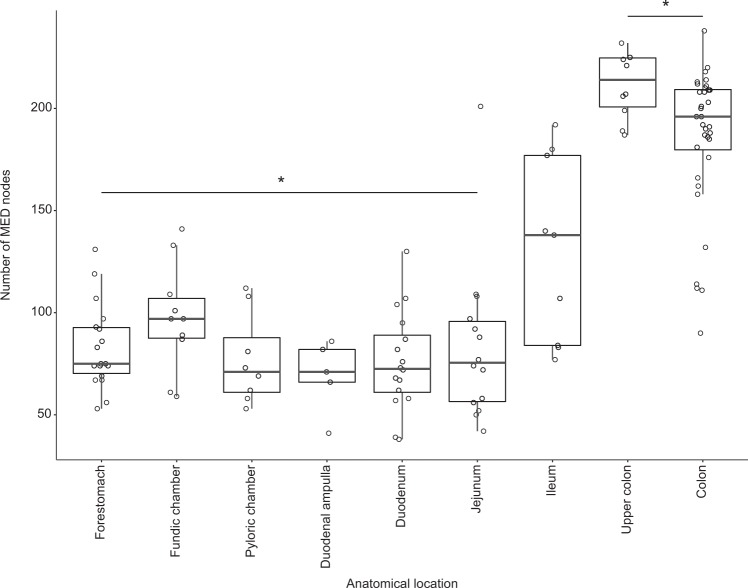
Fig. 3.
Microbial community richness, the number of observed minimum entropy decomposition (MED) nodes, in 121 samples of gastrointestinal (GI) contents collected from 38 bowhead whales. Five summary statistics are visualized in the boxplot: median, the two hinges, which correspond to the 25th and 75th percentiles (the first and third quartiles), and the upper and lower whiskers, which extend from the upper and lower hinges to the largest and smallest values no further than 1.5 times the inter-quartile range (the range between the hinges). Asterisks indicate the forestomach through the duodenum are significantly different from both large intestine sites (P < 0.02)

