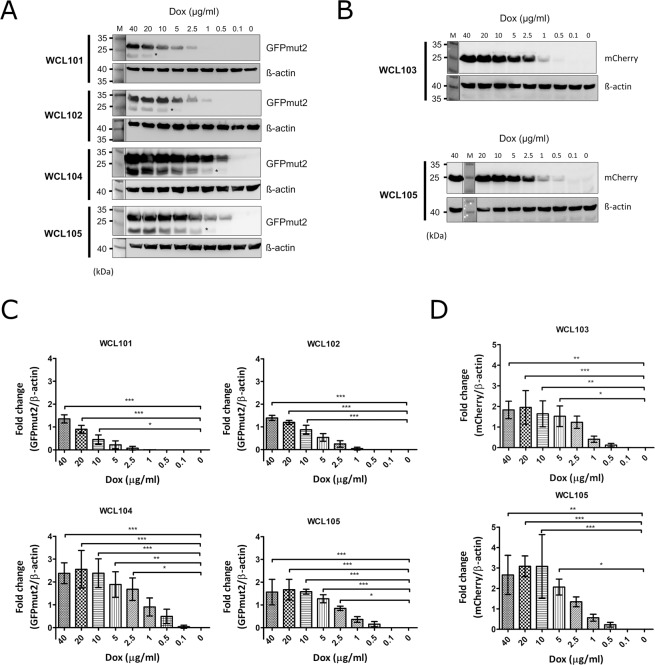
Figure 2.
Quantification of the doxycycline-inducible expression level of fluorescent proteins in C. albicans. (A) GFPmut2 was used as an indicator to quantify expression under the Tet-on system in a dose-dependent manner. C. albicans cells from strains WCL101, WCL102, WCL104, and WCL105 were grown in YPD with the indicated concentration of doxycycline for 3 hours, followed by western blotting to analyse the amount of GFPmut2 in the cell lysates. β-Actin was used as an internal control. Asterisks indicate non-specific signals. (B) mCherry was used as another indicator to quantify expression under the Tet-on system in a dose-dependent manner. C. albicans cells from strains WCL103 and WCL105 were grown in YPD with the indicated concentration of doxycycline for 3 hours, and their lysates were subjected to western blotting to analyse the amount of mCherry in the cells. β-Actin was used as an internal control. (C) The change in doxycycline-inducible GFPmut2 expression. The GFPmut2 and β-actin signals on the blots shown in (A) were quantified with ImageJ. The bar charts show the fold change in GFPmut2 expression normalized to the relevant β-actin expression analysed with one-way ANOVA with Bonferroni’s comparison test. (D) The change in doxycycline-induced mCherry expression. The mCherry and β-actin signals on the blots shown in (B). The bar charts were obtained with the same formula used for (C). The numbers of asterisks show the significance of the difference between two values compared by statistical analysis.

