Figure 1.
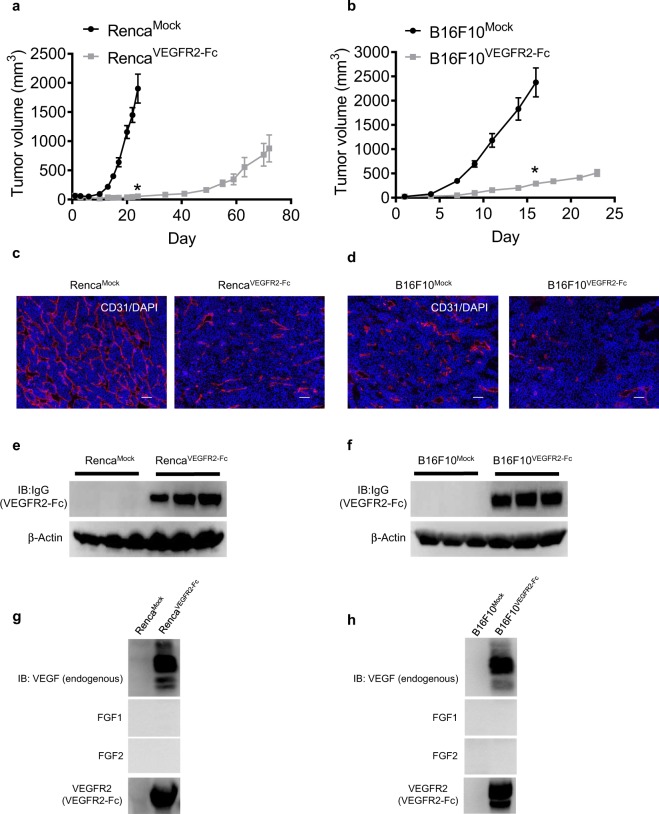
In vivo tumor growth and angiogenesis of Mock and VEGFR2-Fc–expressing tumors. (a,b) In vivo tumor growth of Mock and VEGFR2-Fc–expressing tumors. (a) Renca model; (b) B16F10 model. Data are means ± SEM (n = 7 in Renca model and n = 8 in B16F10 model). *p < 0.05 (unpaired t-test). Comparison of tumor volumes between Mock and VEGFR2-Fc–expressing groups was conducted for the last time point of the Mock group in (a) Day 24 and (b) Day 16. (c,d) Tumor angiogenesis of Mock and VEGFR2-Fc–expressing tumors. Representative images of CD31 staining (marker of endothelial cells; red) and DAPI (4′,6-diamidino-2-phenylindole) (marker of DNA; blue). (c) Renca model; (d) B16F10 model. Scale bars represent 100 μm. (e,f) Expression of VEGFR2-Fc (detected by anti-IgG Ab) in tumors resected at volumes of ~500 mm3. (e) Renca model; (f) B16F10 model. Three independent tumors were analyzed. (g,h) Immunoprecipitation assay for co-precipitation of VEGFR2-Fc with endogenous VEGF, FGF1, or FGF2 in Mock or VEGFR2-Fc–expressing tumor lysates. (g) Renca model; (h) B16F10 model. IB, Immunoblotting.

